Basingstoke and Deane Borough Council election, 2007
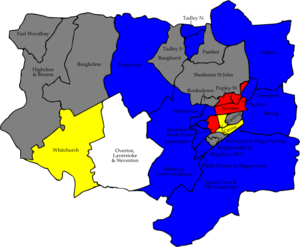
Map of the results of the 2007 Basingstoke and Deane council election.
Conservatives in blue,
Labour in red, Liberal Democrats in yellow and independent in white. Wards in grey were not contested in 2007.
The 2007 Basingstoke and Deane Council election took place on 3 May 2007 to elect members of Basingstoke and Deane Borough Council in Hampshire, England. One third of the council was up for election and the Conservative party stayed in overall control of the council.[1]
After the election, the composition of the council was
Background
The Conservative party had run the council since the 2006 election and won an overall majority for the first time in 11 years after gaining a seat in a by-election in Buckskin from Labour in December 2006.[3] In March 2007 the Conservatives also held a seat in a by-election in Rooksdown.[3] This meant that the Conservative held 31 seats going into the election, compared to 15 Liberal Democrat, 11 Labour and 3 Independent councillors.[3]
5 councillors stood down at the election, 3 Conservatives and 2 Liberal Democrats, Jonathan Curry, Terence Faulkner, Paul Findlow, Alex Green and John Wall.[3] 20 seats were up for election, with the leader of the Conservatives on the council, Mark Ruffell, being unopposed in Upton Grey and the Candovers.[3] Candidates stood from the Conservative, Liberal Democrat and Labour parties, as well as 2 independents.[3][4]
Election result
The results saw the Conservatives stay in control with 31 seats, with no changes taking place in the political balance on the council.[5] The Liberal Democrats remained on 15 seats, Labour on 11 and independents on 3 seats.[2]
| Basingstoke and Deane Local Election Result 2007[6] |
| Party |
Seats |
Gains |
Losses |
Net gain/loss |
Seats % |
Votes % |
Votes |
+/− |
| |
Conservative |
12 |
0 |
0 |
0 |
60.0 |
54.4 |
18,593 |
+4.7% |
| |
Labour |
4 |
0 |
0 |
0 |
20.0 |
18.4 |
6,282 |
+2.8% |
| |
Liberal Democrat |
3 |
0 |
0 |
0 |
15.0 |
23.6 |
8,053 |
-6.9% |
| |
Independent |
1 |
0 |
0 |
0 |
5.0 |
3.7 |
1,250 |
+0.9% |
Ward results
| Brookvale and Kings Furlong[6] |
| Party |
Candidate |
Votes |
% |
±% |
|
Liberal Democrat |
Doris Jones |
823 |
56.9 |
+4.5 |
|
Conservative |
Ranil Jayawardena |
430 |
29.7 |
+3.0 |
|
Labour |
Philip Courtenay |
193 |
13.3 |
-1.4 |
| Majority |
393 |
27.2 |
+1.5 |
| Turnout |
1,446 |
36 |
+1 |
|
Liberal Democrat hold |
Swing |
|
|
| Chineham[6] |
| Party |
Candidate |
Votes |
% |
±% |
|
Conservative |
John Downes |
1,258 |
63.2 |
+24.5 |
|
Independent |
Christopher Tomblin |
393 |
19.7 |
-34.5 |
|
Labour |
Eileen Cavanagh |
191 |
9.6 |
+2.5 |
|
Liberal Democrat |
Janice Spalding |
149 |
7.5 |
+7.5 |
| Majority |
865 |
43.4 |
|
| Turnout |
1,991 |
34 |
+0 |
|
Conservative hold |
Swing |
|
|
| Grove[6] |
| Party |
Candidate |
Votes |
% |
±% |
|
Liberal Democrat |
Stephen Day |
1,261 |
66.6 |
+5.0 |
|
Conservative |
Hayley Eachus |
538 |
28.4 |
-5.5 |
|
Labour |
Hema Krishan |
94 |
5.0 |
+0.5 |
| Majority |
723 |
38.2 |
+10.5 |
| Turnout |
1,893 |
43 |
-4 |
|
Liberal Democrat hold |
Swing |
|
|
| Hatch Warren and Beggarwood[6] |
| Party |
Candidate |
Votes |
% |
±% |
|
Conservative |
Harry Robinson |
1,398 |
69.6 |
+0.5 |
|
Liberal Democrat |
Roger Barnard |
363 |
18.1 |
-1.0 |
|
Labour |
Julie Worthington |
248 |
12.3 |
+0.5 |
| Majority |
1,035 |
51.5 |
+1.5 |
| Turnout |
2,009 |
29 |
-2 |
|
Conservative hold |
Swing |
|
|
| Kempshott[6] |
| Party |
Candidate |
Votes |
% |
±% |
|
Conservative |
Christine Heath |
1,749 |
70.9 |
-0.7 |
|
Liberal Democrat |
Tom Mitchell |
381 |
15.5 |
+0.3 |
|
Labour |
Colin Regan |
336 |
13.6 |
+0.4 |
| Majority |
1,368 |
55.5 |
-0.9 |
| Turnout |
2,466 |
41 |
-1 |
|
Conservative hold |
Swing |
|
|
| Kingsclere[6] |
| Party |
Candidate |
Votes |
% |
±% |
|
Conservative |
Cathy Osselton |
1,277 |
78.4 |
-1.5 |
|
Labour |
James Gibb |
186 |
11.4 |
-0.3 |
|
Liberal Democrat |
Roger Ward |
165 |
10.1 |
+1.7 |
| Majority |
1,091 |
67.0 |
-1.2 |
| Turnout |
1,628 |
44 |
+1 |
|
Conservative hold |
Swing |
|
|
| Norden[6] |
| Party |
Candidate |
Votes |
% |
±% |
|
Labour |
Paul Harvey |
1,057 |
54.4 |
-2.1 |
|
Conservative |
Onnalee Cubitt |
615 |
31.7 |
+2.6 |
|
Liberal Democrat |
Richard Whitechurch |
270 |
13.9 |
-0.5 |
| Majority |
442 |
22.8 |
-4.6 |
| Turnout |
1,942 |
33 |
+1 |
|
Labour hold |
Swing |
|
|
| Oakley and North Waltham[6] |
| Party |
Candidate |
Votes |
% |
±% |
|
Conservative |
Diane Taylor |
1,801 |
74.6 |
+10.3 |
|
Liberal Democrat |
John Burbidge-King |
442 |
18.3 |
-17.4 |
|
Labour |
David Cavanagh |
171 |
7.1 |
+7.1 |
| Majority |
1,359 |
56.3 |
+27.6 |
| Turnout |
2,414 |
43 |
-2 |
|
Conservative hold |
Swing |
|
|
| Overton, Laverstoke and Steventon[6] |
| Party |
Candidate |
Votes |
% |
±% |
|
Independent |
Ian Tilbury |
857 |
49.2 |
+49.2 |
|
Conservative |
Marion Jones |
481 |
27.6 |
-2.8 |
|
Liberal Democrat |
Jacky Lessware |
328 |
18.8 |
-45.2 |
|
Labour |
Warwick Dady |
76 |
4.4 |
-1.2 |
| Majority |
376 |
21.6 |
|
| Turnout |
1,742 |
50 |
-1 |
|
Independent hold |
Swing |
|
|
| Popley East[6] |
| Party |
Candidate |
Votes |
% |
±% |
|
Labour |
Andy McCormick |
629 |
63.6 |
+11.9 |
|
Conservative |
Stephen McConnell |
223 |
22.5 |
-9.1 |
|
Liberal Democrat |
Michael Berwick-Gooding |
137 |
13.9 |
-2.8 |
| Majority |
406 |
41.1 |
+21.1 |
| Turnout |
989 |
31 |
+2 |
|
Labour hold |
Swing |
|
|
| Popley West[6] |
| Party |
Candidate |
Votes |
% |
±% |
|
Labour |
Paul Frankum |
534 |
53.5 |
+3.9 |
|
Conservative |
Zoe Wheddon |
354 |
35.4 |
+6.5 |
|
Liberal Democrat |
Angela Old |
111 |
11.1 |
-10.4 |
| Majority |
180 |
18.0 |
-2.7 |
| Turnout |
999 |
39 |
+9 |
|
Labour hold |
Swing |
|
|
| South Ham[6] |
| Party |
Candidate |
Votes |
% |
±% |
|
Labour |
Sean Keating |
959 |
49.4 |
-4.0 |
|
Conservative |
Valerie Valentine |
741 |
38.2 |
+2.7 |
|
Liberal Democrat |
Stephen Whitechurch |
240 |
12.4 |
+1.3 |
| Majority |
218 |
11.2 |
-6.6 |
| Turnout |
1,940 |
35 |
-1 |
|
Labour hold |
Swing |
|
|
| Tadley North[6] |
| Party |
Candidate |
Votes |
% |
±% |
|
Conservative |
Stephen West |
1,048 |
55.3 |
+16.6 |
|
Liberal Democrat |
Josephine Slimin |
732 |
38.6 |
-22.7 |
|
Labour |
Stephen Rothman |
114 |
6.0 |
+6.0 |
| Majority |
316 |
16.7 |
|
| Turnout |
1,894 |
43 |
+0 |
|
Conservative hold |
Swing |
|
|
| Tadley South[6] |
| Party |
Candidate |
Votes |
% |
±% |
|
Conservative |
Robert Musson |
872 |
66.1 |
+26.1 |
|
Liberal Democrat |
Ian Hankinson |
337 |
25.5 |
+25,5 |
|
Labour |
Upali Wickremeratne |
110 |
8.3 |
-3.7 |
| Majority |
535 |
40.6 |
|
| Turnout |
1,319 |
31 |
-2 |
|
Conservative hold |
Swing |
|
|
| Whitchurch[6] |
| Party |
Candidate |
Votes |
% |
±% |
|
Liberal Democrat |
Keith Watts |
1,163 |
58.4 |
|
|
Conservative |
William Judge |
828 |
41.6 |
|
| Majority |
335 |
16.8 |
|
| Turnout |
1,991 |
52 |
+4 |
|
Liberal Democrat hold |
Swing |
|
|
| Winklebury[6] |
| Party |
Candidate |
Votes |
% |
±% |
|
Conservative |
Rob Golding |
1,289 |
64.8 |
+2.2 |
|
Labour |
Lea Jeff |
548 |
27.6 |
-9.8 |
|
Liberal Democrat |
Chijioke Nwasike |
152 |
7.6 |
+7.6 |
| Majority |
741 |
37.3 |
+12.2 |
| Turnout |
1,989 |
39 |
-4 |
|
Conservative hold |
Swing |
|
|
References
Preceded by
Basingstoke and Deane Council election, 2006 |
Basingstoke and Deane local elections |
Succeeded by
Basingstoke and Deane Council election, 2008 |