Basildon District Council election, 2003
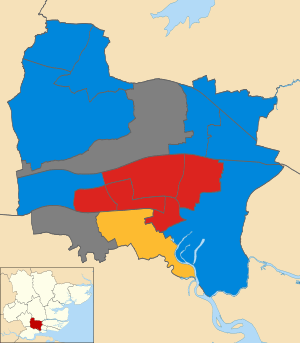
Map of the results of the 2003 Basildon council election.
Conservatives in blue,
Labour in red and Liberal Democrats in yellow. Wards in grey were not contested in 2003.
The 2003 Basildon District Council election took place on 1 May 2003 to elect members of Basildon District Council in Essex, England. One third of the council was up for election and the Conservative party gained overall control of the council from no overall control.[1]
After the election, the composition of the council was
Background
The previous election in 2002 saw the Conservatives win exactly half of the seats, but Labour remained in control of the council with the support of the Liberal Democrats.[3] However 6 months before the 2003 election 2 Labour councillors defected and the Conservatives took over the administration of the council.[4]
Election result
The results saw the Conservatives win a majority for only the second time in the history of Basildon council.[5]
Following the election the Labour leader on the council Nigel Smith was replaced by his group with Paul Kirkman.[4]
| Basildon Local Election Result 2003[6] |
| Party |
Seats |
Gains |
Losses |
Net gain/loss |
Seats % |
Votes % |
Votes |
+/− |
| |
Conservative |
8 |
2 |
0 |
+2 |
57.1 |
45.3 |
12,090 |
-2.7% |
| |
Labour |
5 |
0 |
2 |
-2 |
35.7 |
27.9 |
7,441 |
-6.5% |
| |
Liberal Democrat |
1 |
0 |
0 |
0 |
7.1 |
19.7 |
5,255 |
+3.1% |
| |
BNP |
0 |
0 |
0 |
0 |
0 |
4.1 |
1,104 |
+3.9% |
| |
Independent |
0 |
0 |
0 |
0 |
0 |
1.9 |
510 |
+1.2% |
| |
Green |
0 |
0 |
0 |
0 |
0 |
1.1 |
299 |
+1.1% |
Ward results
| Fryerns[6] |
| Party |
Candidate |
Votes |
% |
±% |
|
Labour |
Julia Woods |
966 |
43.4 |
|
|
BNP |
William Bake |
487 |
21.9 |
|
|
Conservative |
Kenneth Evens |
427 |
19.2 |
|
|
Liberal Democrat |
John Lutton |
223 |
10.0 |
|
|
Green |
Adam Ellis |
124 |
5.6 |
|
| Majority |
479 |
21.5 |
|
| Turnout |
2,227 |
|
|
|
Labour hold |
Swing |
|
|
| Laindon Park[6] |
| Party |
Candidate |
Votes |
% |
±% |
|
Conservative |
David Walsh |
844 |
43.6 |
|
|
Labour |
Anthony Borlase |
780 |
40.3 |
|
|
Liberal Democrat |
Dorothy Edwards |
163 |
8.4 |
|
|
Independent |
Jason Richardson |
97 |
5.0 |
|
|
Independent |
Michael Payne |
51 |
2.6 |
|
| Majority |
64 |
3.3 |
|
| Turnout |
1,935 |
|
|
|
Conservative gain from Labour |
Swing |
|
|
| Lee Chapel North[6] |
| Party |
Candidate |
Votes |
% |
±% |
|
Labour |
Richard Rackham |
766 |
40.6 |
|
|
Conservative |
Richard Hyland |
434 |
23.0 |
|
|
BNP |
Sidney Chaney |
285 |
15.1 |
|
|
Liberal Democrat |
Michael Martin |
207 |
11.0 |
|
|
Green |
Ernest Humphries |
114 |
6.0 |
|
|
Independent |
Steven Denne |
80 |
4.2 |
|
| Majority |
332 |
17.6 |
|
| Turnout |
1,886 |
|
|
|
Labour hold |
Swing |
|
|
| Nethermayne[6] |
| Party |
Candidate |
Votes |
% |
±% |
|
Liberal Democrat |
Benjamin Williams |
1,168 |
48.1 |
|
|
Labour |
Lynda Gordon |
672 |
27.7 |
|
|
Conservative |
Henry Tucker |
586 |
24.2 |
|
| Majority |
496 |
20.4 |
|
| Turnout |
2,426 |
|
|
|
Liberal Democrat hold |
Swing |
|
|
| Pitsea North West[6] |
| Party |
Candidate |
Votes |
% |
±% |
|
Labour |
Philip Rackley |
738 |
48.3 |
|
|
Conservative |
Mark Levey |
541 |
35.4 |
|
|
Liberal Democrat |
Martin Howard |
248 |
16.2 |
|
| Majority |
197 |
12.9 |
|
| Turnout |
1,527 |
|
|
|
Labour hold |
Swing |
|
|
| Pitsea South East[6] |
| Party |
Candidate |
Votes |
% |
±% |
|
Conservative |
Malcolm Geddes |
771 |
36.1 |
|
|
Labour |
Michael Plant |
717 |
33.6 |
|
|
BNP |
David King |
332 |
15.5 |
|
|
Liberal Democrat |
Vivien Howard |
169 |
7.9 |
|
|
Independent |
Raymond Abrahall |
87 |
4.1 |
|
|
Green |
David Wilkinson |
61 |
2.9 |
|
| Majority |
54 |
2.5 |
|
| Turnout |
2,137 |
|
|
|
Conservative gain from Labour |
Swing |
|
|
| St Martin's[6] |
| Party |
Candidate |
Votes |
% |
±% |
|
Labour |
Colin Payn |
563 |
47.0 |
|
|
Conservative |
Deborah Allen |
351 |
29.3 |
|
|
Liberal Democrat |
Michael Dickinson |
178 |
14.8 |
|
|
Independent |
Alfred Viccary |
107 |
8.9 |
|
| Majority |
212 |
17.7 |
|
| Turnout |
1,199 |
|
|
|
Labour hold |
Swing |
|
|
| Vange[6] |
| Party |
Candidate |
Votes |
% |
±% |
|
Labour |
Swatantra Nandanwar |
507 |
41.9 |
|
|
Conservative |
Philip Johnson |
452 |
37.4 |
|
|
Liberal Democrat |
Mark Hersom |
163 |
13.5 |
|
|
Independent |
John Cord |
88 |
7.3 |
|
| Majority |
55 |
4.5 |
|
| Turnout |
1,210 |
|
|
|
Labour hold |
Swing |
|
|
References