Basildon Borough Council election, 2011
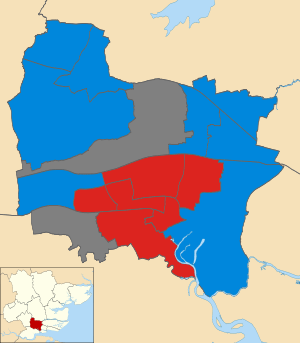
Map of the results of the 2011 Basildon council election.
Conservatives in blue and
Labour in red. Wards in grey were not contested in 2011.
The 2011 Basildon Council election took place on 5 May 2011 to elect members of Basildon Borough Council in Essex, England. One third of the council was up for election and the Conservative party stayed in overall control of the council.[1]
After the election, the composition of the council was
Election result
The results saw the Conservatives stay in control of the council after retaining all of the seats they had been defending.[3] This left the Conservatives with 29 seats, compared to 11 for Labour.[4] Meanwhile the Liberal Democrats were reduced to 2 councillors and the party lost vote share across the council.[5] Overall turnout in the election was 35%.[6]
The only change in the election saw Labour gain 1 seat from the Liberal Democrats in Nethermayne, with the winning Labour candidate, Andrew Gordon, becoming the youngest councillor at the age of 18.[5] Among the other winners was Daniel Munyambu for Labour in Vange, who became the second Kenyan to be elected as a councillor in the United Kingdom,[7] and the former council leader Nigel Smith who returned to the council in Lee Chapel North.[5]
| Basildon Local Election Result 2011[6] |
| Party |
Seats |
Gains |
Losses |
Net gain/loss |
Seats % |
Votes % |
Votes |
+/− |
| |
Conservative |
8 |
0 |
0 |
0 |
53.3 |
46.0 |
19,430 |
-3.6% |
| |
Labour |
7 |
1 |
0 |
+1 |
46.7 |
32.1 |
13,532 |
+10.7% |
| |
Liberal Democrat |
0 |
0 |
1 |
-1 |
0 |
8.9 |
3,766 |
-9.4% |
| |
UKIP |
0 |
0 |
0 |
0 |
0 |
8.2 |
3,475 |
+4.7% |
| |
Independent |
0 |
0 |
0 |
0 |
0 |
3.2 |
1,336 |
+3.2% |
| |
BNP |
0 |
0 |
0 |
0 |
0 |
0.8 |
356 |
-6.4% |
| |
National Front |
0 |
0 |
0 |
0 |
0 |
0.6 |
244 |
+0.6% |
| |
None of The Above |
0 |
0 |
0 |
0 |
0 |
0.1 |
63 |
+0.1% |
Ward results
| Billericay East[6][5] |
| Party |
Candidate |
Votes |
% |
±% |
|
Conservative |
David Dadds |
2,626 |
64.6 |
+3.5 |
|
Labour |
Lady Patricia Reid |
567 |
13.9 |
+2.9 |
|
Liberal Democrat |
Nigel Horn |
528 |
13.0 |
-7.3 |
|
UKIP |
Susan McCaffery |
346 |
8.5 |
+3.9 |
| Majority |
2,059 |
50.6 |
+9.9 |
| Turnout |
4,067 |
44.2 |
-30 |
|
Conservative hold |
Swing |
|
|
| Billericay West[6][5] |
| Party |
Candidate |
Votes |
% |
±% |
|
Conservative |
Lord Stephen Horgan |
2,416 |
59.3 |
-3.9 |
|
UKIP |
Terry Gandy |
665 |
16.3 |
+12.7 |
|
Labour |
Geoffrey Bores |
584 |
14.3 |
+3.0 |
|
Liberal Democrat |
John James |
407 |
10.0 |
-8.6 |
| Majority |
1,751 |
43.0 |
-1.6 |
| Turnout |
4,072 |
43.5 |
-30 |
|
Conservative hold |
Swing |
|
|
| Burstead[6][5] |
| Party |
Candidate |
Votes |
% |
±% |
|
Conservative |
Kevin Blake |
2,330 |
62.9 |
+4.6 |
|
Labour |
Sandra Bennett |
615 |
16.6 |
+5.1 |
|
Liberal Democrat |
Stewart Goshawk |
393 |
10.6 |
-6.1 |
|
UKIP |
Cherry Young |
367 |
9.9 |
+0.5 |
| Majority |
1,715 |
46.3 |
+4.8 |
| Turnout |
3,705 |
43.6 |
-29 |
|
Conservative hold |
Swing |
|
|
| Lee Chapel North[6][5] |
| Party |
Candidate |
Votes |
% |
±% |
|
Labour |
Nigel Smith |
1,408 |
54.9 |
+17.5 |
|
Conservative |
Christine Hedley |
740 |
28.8 |
-5.1 |
|
National Front |
Thomas Beaney |
244 |
9.5 |
+9.5 |
|
Liberal Democrat |
Emma Peall |
173 |
6.7 |
-10.9 |
| Majority |
668 |
26.0 |
+22.5 |
| Turnout |
2,565 |
29.2 |
-26 |
|
Labour hold |
Swing |
|
|
| Nethermayne[6][5] |
| Party |
Candidate |
Votes |
% |
±% |
|
Labour |
Andrew Gordon |
926 |
30.2 |
+6.5 |
|
Liberal Democrat |
Phil Jenkins |
752 |
24.5 |
-11.9 |
|
Conservative |
Stephen Foster |
709 |
23.1 |
-8.1 |
|
UKIP |
Kerry Smith |
619 |
20.2 |
+20.2 |
|
None of The Above |
X |
63 |
2.1 |
+2.1 |
| Majority |
174 |
5.7 |
|
| Turnout |
3,069 |
34.9 |
-28 |
|
Labour gain from Liberal Democrat |
Swing |
|
|
| Pitsea North West[6][5] |
| Party |
Candidate |
Votes |
% |
±% |
|
Labour |
Keith Bobbin |
1,111 |
47.3 |
+16.2 |
|
Conservative |
Danny Lawrence |
702 |
29.9 |
-4.2 |
|
UKIP |
Terry McBride |
391 |
16.7 |
+7.4 |
|
Liberal Democrat |
Martin Howard |
143 |
6.1 |
-9.8 |
| Majority |
409 |
17.4 |
|
| Turnout |
2,347 |
25.5 |
-27 |
|
Labour hold |
Swing |
|
|
| Pitsea South East[6][5] |
| Party |
Candidate |
Votes |
% |
±% |
|
Conservative |
Mo Larkin |
1,197 |
43.6 |
+3.9 |
|
Labour |
Mark Walker |
1,056 |
38.4 |
+6.6 |
|
UKIP |
Imelda Clancy |
384 |
14.0 |
+5.5 |
|
Liberal Democrat |
Vivien Howard |
110 |
4.0 |
-7.6 |
| Majority |
141 |
5.1 |
-2.9 |
| Turnout |
2,747 |
32.3 |
-26 |
|
Conservative hold |
Swing |
|
|
| St Martin's[6][5] |
| Party |
Candidate |
Votes |
% |
±% |
|
Labour |
Patricia Rackley |
1,004 |
57.8 |
+19.7 |
|
Conservative |
Andrew Schrader |
557 |
32.0 |
+3.2 |
|
Liberal Democrat |
Michael Dickinson |
177 |
10.2 |
-1.3 |
| Majority |
447 |
25.7 |
+16.4 |
| Turnout |
1,738 |
29.5 |
+6 |
|
Labour hold |
Swing |
|
|
| Vange[6][5] |
| Party |
Candidate |
Votes |
% |
±% |
|
Labour |
Daniel Munyambu |
1,089 |
52.3 |
+21.4 |
|
Conservative |
Andrew Morris |
554 |
26.6 |
-9.2 |
|
UKIP |
Kim Gandy |
338 |
16.2 |
+16.2 |
|
Liberal Democrat |
Elizabeth Grant |
102 |
4.9 |
-1.4 |
| Majority |
535 |
25.7 |
|
| Turnout |
2,083 |
30.6 |
+7 |
|
Labour hold |
Swing |
|
|
| Wickford Castledon[6][5] |
| Party |
Candidate |
Votes |
% |
±% |
|
Conservative |
Sylvia Buckley |
1,434 |
59.7 |
+0.4 |
|
Independent |
Alan Ball |
446 |
18.6 |
+18.6 |
|
Labour |
Sarah Davies |
397 |
16.5 |
-0.8 |
|
Liberal Democrat |
Tony Morris |
127 |
5.3 |
-11.6 |
| Majority |
988 |
41.1 |
-0.9 |
| Turnout |
2,404 |
38.9 |
-30 |
|
Conservative hold |
Swing |
|
|
| Wickford North[6][5] |
| Party |
Candidate |
Votes |
% |
±% |
|
Conservative |
Michael Mowe |
1,925 |
54.1 |
-4.0 |
|
Independent |
Dave Harrison |
890 |
25.0 |
+25.0 |
|
Labour |
Thomas Kirkman |
590 |
16.6 |
+0.2 |
|
Liberal Democrat |
John Spriggs |
155 |
4.4 |
-13.0 |
| Majority |
1,035 |
29.1 |
-11.6 |
| Turnout |
3,560 |
37.3 |
-29 |
|
Conservative hold |
Swing |
|
|
| Wickford Park[6][5] |
| Party |
Candidate |
Votes |
% |
±% |
|
Conservative |
Chris Jackman |
1,528 |
68.8 |
+10.1 |
|
Labour |
Andrew Buxton |
464 |
20.9 |
+5.3 |
|
Liberal Democrat |
John McGarrigle |
229 |
10.3 |
-8.2 |
| Majority |
1,064 |
47.9 |
+7.7 |
| Turnout |
2,221 |
32.1 |
-32 |
|
Conservative hold |
Swing |
|
|
References
|
|---|
| | Metropolitan boroughs |
- Barnsley
- Birmingham
- Bolton
- Bradford
- Bury
- Calderdale
- Coventry
- Doncaster
- Dudley
- Gateshead
- Kirklees
- Knowsley
- Leeds
- Liverpool
- Manchester
- Newcastle upon Tyne
- North Tyneside
- Oldham
- Rochdale
- Rotherham
- Salford
- Sandwell
- Sefton
- Sheffield
- Solihull
- South Tyneside
- St Helens
- Stockport
- Sunderland
- Tameside
- Trafford
- Wakefield
- Walsall
- Wigan
- Wirral
- Wolverhampton
|
|---|
| | Unitary authorities | |
|---|
| | District councils (England) | |
|---|
| | District councils (Northern Ireland) |
- Antrim
- Ards
- Armagh
- Ballymena
- Ballymoney
- Banbridge
- Belfast
- Carrickfergus
- Castlereagh
- Coleraine
- Cookstown
- Craigavon
- Derry
- Down
- Dungannon and South Tyrone
- Fermanagh
- Larne
- Limavady
- Lisburn
- Magherafelt
- Moyle
- Newry and Mourne
- Newtownabbey
- North Down
- Omagh
- Strabane
|
|---|
| | Mayoral elections | |
|---|
| | National Assembly elections | |
|---|
| | Referendums | |
|---|
|