Amber Valley Borough Council election, 2010
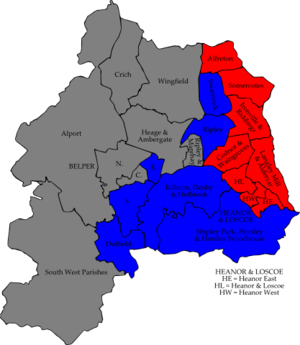
Map of the results of the 2010 Amber Valley council election.
Labour in red and
Conservatives in blue. Wards in grey were not contested in 2010.
The 2010 Amber Valley Borough Council election took place on 6 May 2010 to elect members of Amber Valley Borough Council in Derbyshire, England. One third of the council was up for election and the Conservative party stayed in overall control of the council.[1]
After the election, the composition of the council was
Campaign
15 seats were contested in the election by a total of 50 candidates.[3]
The Conservatives campaigned on their record of controlling the council for the previous 10 years, pointing to keeping council tax increases low and plans to regenerate local towns.[4] However Labour pledged to appoint people as area managers who would be a contact point for people to bring any problems and planned to use compulsory purchase orders to bring empty properties into use.[4] Meanwhile the Liberal Democrats targeted seats in Belper and Duffield campaigning on regeneration, recycling and litter, while the British National Party hoped to increase on the 2 seats they held in Heanor.[4]
Election result
The results saw no change in the party balance as Labour held the 8 seats they had been defending and the Conservatives the other 7 seats, meaning the Conservatives remained in control of the council.[5] Neither the Liberal Democrats or British National Party won any seats, with the British National Party vote dropping in Heanor where it held 2 seats.[5]
| Amber Valley Local Election Result 2010[2][6] |
| Party |
Seats |
Gains |
Losses |
Net gain/loss |
Seats % |
Votes % |
Votes |
+/− |
| |
Labour |
8 |
0 |
0 |
0 |
53.3 |
35.8 |
17,024 |
+2.9% |
| |
Conservative |
7 |
0 |
0 |
0 |
46.7 |
40.2 |
19,154 |
-7.6% |
| |
Liberal Democrat |
0 |
0 |
0 |
0 |
0 |
17.5 |
8,352 |
+12.4% |
| |
BNP |
0 |
0 |
0 |
0 |
0 |
5.7 |
2,725 |
-6.5% |
| |
National Front |
0 |
0 |
0 |
0 |
0 |
0.4 |
185 |
+0.4% |
| |
Independent |
0 |
0 |
0 |
0 |
0 |
0.3 |
164 |
+0.3% |
Ward results
| Alfreton[6] |
| Party |
Candidate |
Votes |
% |
±% |
|
Labour |
John Walker |
1,805 |
47.7 |
-0.5 |
|
Conservative |
David Cantrill |
1,094 |
28.9 |
-11.5 |
|
Liberal Democrat |
Kieran Harley |
566 |
15.0 |
+3.6 |
|
BNP |
Michael White |
319 |
8.4 |
+8.4 |
| Majority |
711 |
18.8 |
+11.0 |
| Turnout |
3,784 |
|
|
|
Labour hold |
Swing |
|
|
| Belper South[6] |
| Party |
Candidate |
Votes |
% |
±% |
|
Conservative |
Jim Anderson |
1,247 |
43.0 |
-6.5 |
|
Liberal Democrat |
Emily Bamford |
840 |
28.9 |
+28.9 |
|
Labour |
Richard Salmon |
816 |
28.1 |
-2.9 |
| Majority |
407 |
14.0 |
-4.5 |
| Turnout |
2,903 |
|
|
|
Conservative hold |
Swing |
|
|
| Codnor and Waingroves[6] |
| Party |
Candidate |
Votes |
% |
±% |
|
Labour |
George Parkes |
1,159 |
43.3 |
+1.6 |
|
Conservative |
Robert Phillips-Forsyth |
1,127 |
42.1 |
+0.4 |
|
BNP |
Ken Cooper |
391 |
14.6 |
-2.0 |
| Majority |
32 |
1.2 |
+1.2 |
| Turnout |
2,677 |
|
|
|
Labour hold |
Swing |
|
|
| Heanor East[6] |
| Party |
Candidate |
Votes |
% |
±% |
|
Labour |
Barry Aistrop |
1,038 |
35.9 |
+5.1 |
|
Conservative |
Alex Stevenson |
965 |
33.3 |
+0.6 |
|
BNP |
Emma Roper |
451 |
15.6 |
-20.9 |
|
Liberal Democrat |
Peter Jelf |
440 |
15.2 |
+15.2 |
| Majority |
73 |
2.5 |
|
| Turnout |
2,894 |
|
|
|
Labour hold |
Swing |
|
|
| Heanor West[6] |
| Party |
Candidate |
Votes |
% |
±% |
|
Labour |
Paul Jones |
1,160 |
37.6 |
+7.1 |
|
Conservative |
Linda Edwards-Milsom |
970 |
31.4 |
+9.0 |
|
BNP |
Maria Riley-Ward |
542 |
17.6 |
-22.0 |
|
Liberal Democrat |
Gavin Sarkas-Bosman |
416 |
13.5 |
+6.0 |
| Majority |
190 |
6.2 |
|
| Turnout |
3,088 |
|
|
|
Labour hold |
Swing |
|
|
| Ironville and Riddings[6] |
| Party |
Candidate |
Votes |
% |
±% |
|
Labour |
Paul Smith |
1,457 |
48.7 |
+7.3 |
|
Conservative |
David Harrison |
1,087 |
36.3 |
-22.3 |
|
Liberal Democrat |
Judith Woolley |
448 |
15.0 |
+15.0 |
| Majority |
370 |
12.4 |
|
| Turnout |
2,992 |
|
|
|
Labour hold |
Swing |
|
|
| Kilburn, Denby and Holbrook[6] |
| Party |
Candidate |
Votes |
% |
±% |
|
Conservative |
Jean Gemmell |
2,097 |
48.6 |
-6.6 |
|
Labour |
John Banks |
1,352 |
31.3 |
+11.0 |
|
Liberal Democrat |
Margaret Tomkins |
869 |
20.1 |
+7.3 |
| Majority |
745 |
17.3 |
-17.6 |
| Turnout |
4,318 |
|
|
|
Conservative hold |
Swing |
|
|
| Langley Mill and Aldecar[6] |
| Party |
Candidate |
Votes |
% |
±% |
|
Labour |
Eileen Hamilton |
931 |
38.4 |
-4.4 |
|
Conservative |
Liam Rhodes |
753 |
31.1 |
-13.2 |
|
Liberal Democrat |
Christopher Bown |
390 |
16.1 |
+3.2 |
|
National Front |
Timothy Knowles |
185 |
7.6 |
+7.6 |
|
Independent |
Jo Ward |
164 |
6.8 |
+6.8 |
| Majority |
178 |
7.3 |
|
| Turnout |
2,423 |
|
|
|
Labour hold |
Swing |
|
|
| Ripley[6] |
| Party |
Candidate |
Votes |
% |
±% |
|
Conservative |
Liz Bowley |
1,779 |
39.4 |
-20.4 |
|
Labour |
David Williams |
1,662 |
36.8 |
+6.1 |
|
Liberal Democrat |
Paul Gibbons |
635 |
14.1 |
+4.6 |
|
BNP |
Nathan Wilde |
438 |
9.7 |
+9.7 |
| Majority |
117 |
2.6 |
-26.5 |
| Turnout |
4,514 |
|
|
|
Conservative hold |
Swing |
|
|
| Shipley Park, Horsley and Horsley Woodhouse[6] |
| Party |
Candidate |
Votes |
% |
±% |
|
Conservative |
Kevin Parkinson |
1,491 |
44.7 |
-20.4 |
|
Labour |
Eric Lancashire |
1,112 |
33.4 |
-1.5 |
|
Liberal Democrat |
Neil Paget |
729 |
21.9 |
+21.9 |
| Majority |
379 |
11.4 |
-18.8 |
| Turnout |
3,332 |
|
|
|
Conservative hold |
Swing |
|
|
| Somercotes[6] |
| Party |
Candidate |
Votes |
% |
±% |
|
Labour |
Brian Lyttle |
1,443 |
54.9 |
+6.3 |
|
Conservative |
Kat Moss |
759 |
28.9 |
+0.3 |
|
Liberal Democrat |
Keith Falconbridge |
427 |
16.2 |
+16.2 |
| Majority |
684 |
26.0 |
+6.0 |
| Turnout |
2,629 |
|
|
|
Labour hold |
Swing |
|
|
| Swanwick[6] |
| Party |
Candidate |
Votes |
% |
±% |
|
Conservative |
Allen King |
1,610 |
50.4 |
+11.7 |
|
Labour |
Timothy Benson |
983 |
30.8 |
+15.5 |
|
Liberal Democrat |
Michael Bedford |
599 |
18.8 |
+14.3 |
| Majority |
627 |
19.6 |
+15.1 |
| Turnout |
3,192 |
|
|
|
Conservative hold |
Swing |
|
|
References