Amber Valley Borough Council election, 2007
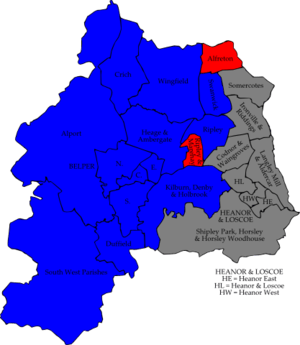
Map of the results of the 2007 Amber Valley council election.
Conservatives in blue and
Labour in red. Wards in grey were not contested in 2007.
Elections to Amber Valley Borough Council were held on 3 May 2007. One third of the council was up for election and the Conservative party held overall control of the council. Overall turnout was 37.7%.
After the election, the composition of the council was
Election result
| Amber Valley Local Election Result 2007 |
| Party |
Seats |
Gains |
Losses |
Net gain/loss |
Seats % |
Votes % |
Votes |
+/− |
| |
Conservative |
13 |
1 |
0 |
+1 |
86.7 |
48.5 |
10,503 |
+5.3% |
| |
Labour |
2 |
0 |
0 |
-1 |
13.3 |
29.4 |
6,378 |
-10.0% |
| |
Liberal Democrat |
0 |
0 |
0 |
0 |
0 |
13.1 |
2,848 |
+13.1% |
| |
BNP |
0 |
0 |
0 |
0 |
0 |
4.8 |
1,048 |
+0.1% |
| |
Independent |
0 |
0 |
0 |
0 |
0 |
2.9 |
634 |
+2.9% |
| |
Green |
0 |
0 |
0 |
0 |
0 |
1.2 |
260 |
+0.1% |
1 Conservative candidate was unopposed.
Ward results
| Alfreton |
| Party |
Candidate |
Votes |
% |
±% |
|
Labour |
Gail Dolman |
1,003 |
48.5 |
-7.3 |
|
Conservative |
Paul West |
527 |
25.5 |
-4.6 |
|
BNP |
Michael White |
344 |
16.6 |
+16.6 |
|
Liberal Democrat |
Keith Falconbridge |
196 |
9.5 |
+9.5 |
| Majority |
476 |
23.0 |
-2.7 |
| Turnout |
2,070 |
33.6 |
+3.6 |
|
Labour hold |
Swing |
|
|
| Belper Central |
| Party |
Candidate |
Votes |
% |
±% |
|
Conservative |
Peter Makin |
781 |
52.6 |
-7.1 |
|
Labour |
Peter Shepard |
479 |
32.3 |
-8.0 |
|
Liberal Democrat |
Janet Thompson |
225 |
15.2 |
+15.2 |
| Majority |
302 |
20.3 |
+0.9 |
| Turnout |
1,485 |
36.1 |
-9.9 |
|
Conservative hold |
Swing |
|
|
| Belper East |
| Party |
Candidate |
Votes |
% |
±% |
|
Conservative |
Les Dorey |
688 |
52.6 |
+1.7 |
|
Labour |
Randall Sanders |
381 |
29.1 |
+0.3 |
|
Liberal Democrat |
Timothy Clark |
240 |
18.3 |
+18.3 |
| Majority |
307 |
23.5 |
+1.4 |
| Turnout |
1,309 |
29.7 |
-1.3 |
|
Conservative hold |
Swing |
|
|
| Belper North |
| Party |
Candidate |
Votes |
% |
±% |
|
Conservative |
Barry Lewis |
641 |
40.8 |
-7.1 |
|
Liberal Democrat |
Hassan Dervish |
569 |
36.2 |
+36.2 |
|
Labour |
Joyce Sanders |
362 |
23.0 |
-2.3 |
| Majority |
72 |
4.6 |
-18.0 |
| Turnout |
1,572 |
39.6 |
-13.4 |
|
Conservative hold |
Swing |
|
|
| Crich |
| Party |
Candidate |
Votes |
% |
±% |
|
Conservative |
Gill Taylor |
508 |
61.1 |
-1.7 |
|
Liberal Democrat |
Kate Smith |
202 |
24.3 |
+24.3 |
|
Labour |
Janis Gregory |
121 |
14.6 |
-4.1 |
| Majority |
306 |
36.8 |
-7.3 |
| Turnout |
831 |
42.9 |
|
|
Conservative hold |
Swing |
|
|
| Duffield |
| Party |
Candidate |
Votes |
% |
±% |
|
Conservative |
Stuart Bradford |
1,005 |
63.7 |
-1.2 |
|
Labour |
Di Hancock |
331 |
21.0 |
+7.6 |
|
Liberal Democrat |
Colin Thompson |
242 |
15.3 |
+15.3 |
| Majority |
674 |
42.7 |
-6.5 |
| Turnout |
1,578 |
42.8 |
-0.2 |
|
Conservative hold |
Swing |
|
|
| Heage & Ambergate |
| Party |
Candidate |
Votes |
% |
±% |
|
Conservative |
Angela Ward |
878 |
56.3 |
+7.6 |
|
Labour |
Christine Worth |
477 |
30.6 |
+0.5 |
|
Liberal Democrat |
Margaret Tomkins |
205 |
13.1 |
+13.1 |
| Majority |
401 |
25.7 |
+7.1 |
| Turnout |
1,560 |
39.6 |
-9.4 |
|
Conservative gain from Labour |
Swing |
|
|
| Kilburn, Denby & Holbrook |
| Party |
Candidate |
Votes |
% |
±% |
|
Conservative |
Mel Hall |
1,098 |
47.3 |
-16.0 |
|
Labour |
Terry Foster |
571 |
24.6 |
-12.1 |
|
BNP |
Alan Warner |
372 |
16.0 |
+16.0 |
|
Liberal Democrat |
John Banks |
281 |
12.1 |
+12.1 |
| Majority |
527 |
22.7 |
-3.9 |
| Turnout |
2,322 |
38.0 |
+2.0 |
|
Conservative hold |
Swing |
|
|
| Ripley |
| Party |
Candidate |
Votes |
% |
±% |
|
Conservative |
David Wilson |
965 |
42.9 |
-5.4 |
|
Labour |
Charles Cutting |
925 |
41.1 |
+4.3 |
|
Liberal Democrat |
Michael Bedford |
359 |
16.0 |
+16.0 |
| Majority |
40 |
1.8 |
-9.7 |
| Turnout |
2,249 |
34.3 |
+2.3 |
|
Conservative hold |
Swing |
|
|
| Ripley & Marehay |
| Party |
Candidate |
Votes |
% |
±% |
|
Labour |
Geoff Carlile |
714 |
42.3 |
-6.9 |
|
Conservative |
Robert Phillips-Forsyth |
597 |
35.3 |
-15.5 |
|
BNP |
Paul Snell |
197 |
11.7 |
+11.7 |
|
Liberal Democrat |
Phil Boothroyd |
181 |
10.7 |
+10.7 |
| Majority |
117 |
7.0 |
|
| Turnout |
1,689 |
36.7 |
-7.3 |
|
Labour hold |
Swing |
|
|
| Swanwick |
| Party |
Candidate |
Votes |
% |
±% |
|
Conservative |
Stephen Hayes |
719 |
38.7 |
-23.0 |
|
Independent |
George Soudah |
634 |
34.2 |
+34.2 |
|
Labour |
Isobel Harry |
284 |
15.3 |
-9.1 |
|
BNP |
Clifford Roper |
135 |
7.3 |
+7.3 |
|
Liberal Democrat |
Gordon Monaghan |
84 |
4.5 |
+4.5 |
| Majority |
85 |
4.5 |
-32.8 |
| Turnout |
1,856 |
43.3 |
+6.3 |
|
Conservative hold |
Swing |
|
|
| Wingfield |
| Party |
Candidate |
Votes |
% |
±% |
|
Conservative |
Valerie Thorpe |
728 |
79.8 |
+2.5 |
|
Labour |
David Williams |
120 |
13.2 |
-9.5 |
|
Liberal Democrat |
Elsie Situnayake |
64 |
7.0 |
+7.0 |
| Majority |
608 |
66.6 |
+12.0 |
| Turnout |
912 |
49.5 |
|
|
Conservative hold |
Swing |
|
|
External links
BBC report of 2007 Amber Valley election result