Affinity diagram
The affinity diagram is a business tool used to organize ideas and data. It is one of the Seven Management and Planning Tools. People have been grouping data into groups based on natural relationships for thousands of years; however, the term affinity diagram was devised by Jiro Kawakita in the 1960s[1] and is sometimes referred to as the KJ Method.
The tool is commonly used within project management and allows large numbers of ideas stemming from brainstorming[2] to be sorted into groups, based on their natural relationships, for review and analysis.[3] It is also frequently used in contextual inquiry as a way to organize notes and insights from field interviews. It can also be used for organizing other freeform comments, such as open-ended survey responses, support call logs, or other qualitative data.
Process
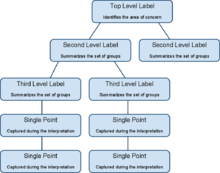
The affinity diagram organizes ideas with following steps:
- Record each idea on cards or notes. Ideas should be at least a noun and verb, preferably a phrase
- Look for ideas that seem to be related.
- Sort cards into groups until all cards have been used.
- Write titles or headers for each group that summarize the essence of the group, preferable at a slightly higher level of abstraction.
One important facet is that the sorting is done without any speaking. This keeps one person from dominating the process and allows more intuitive and creative thinking to come to the fore.
Another useful strategy is to limit the number of ideas that can be put into any one group so that the groups don't become so large as to be meaningless. After one round of grouping, there can be a second round of grouping placing all the ideas under the header and grouping the headers.
Once the cards have been sorted into groups the team may sort large clusters into subgroups for easier management and analysis.[4] Once completed, the affinity diagram may be used to create a cause and effect diagram.[5]
In many cases, the best results tend to be achieved when the activity is completed by a cross-functional team, including key stakeholders. The process requires becoming deeply immersed in the data, which has benefits beyond the tangible deliverables.
References
- ↑ Improving Performance Through Statistical Thinking By Galen C. Britz
- ↑ Affinity Diagram - Kawakita Jiro or KJ Method, Retrieved June 6, 2010
- ↑ Using Affinity Diagrams to make sense from brainstorming
- ↑ Value: Its Measurement, Design and Management By M. Larry Shillito
- ↑ NHS Improvement network
External links
| Wikimedia Commons has media related to Affinity diagrams. |