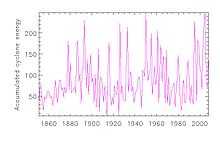
Accumulated cyclone energy
Accumulated cyclone energy (ACE) is a measure used by the National Oceanic and Atmospheric Administration (NOAA) to express the activity of individual tropical cyclones and entire tropical cyclone seasons, particularly the North Atlantic hurricane season. It uses an approximation of the wind energy used by a tropical system over its lifetime and is calculated every six-hour period. The ACE of a season is the sum of the ACEs for each storm and takes into account the number, strength, and duration of all the tropical storms in the season. In recorded history, the highest ACE worldwide is 82, for Hurricane Ioke, in 2006.[1]
Calculation
The ACE of a season is calculated by summing the squares of the estimated maximum sustained velocity of every active tropical storm (wind speed 35 knots (65 km/h) or higher), at six-hour intervals. Since the calculation is sensitive to the starting point of the six-hour intervals, the convention is to use 0000, 0600, 1200, and 1800 UTC. If any storms of a season happen to cross years, the storm's ACE counts for the previous year.[2] The numbers are usually divided by 10,000 to make them more manageable. The unit of ACE is 104 kn2, and for use as an index the unit is assumed. Thus:

where vmax is estimated sustained wind speed in knots.
Kinetic energy is proportional to the square of velocity, and by adding together the energy per some interval of time, the accumulated energy is found. As the duration of a storm increases, more values are summed and the ACE also increases such that longer-duration storms may accumulate a larger ACE than more-powerful storms of lesser duration. Although ACE is a value proportional to the energy of the system, it is not a direct calculation of energy (the mass of the moved air and therefore the size of the storm would show up in a real energy calculation).
A related quantity is hurricane destruction potential (HDP), which is ACE but only calculated for the time where the system is a hurricane.[3]
Atlantic basin ACE
Categories
A season's ACE is used by NOAA and others to categorize the hurricane season into 3 groups by its activity.[4] Measured over the period 1951–2000 for the Atlantic basin, the median annual index was 87.5 and the mean annual index was 93.2. The NOAA categorisation system divides seasons into:
- Above-normal season: An ACE value above 111 (120% of the 1981–2010 median), provided at least two of the following three parameters are also exceeded: number of tropical storms: 12, hurricanes: 6, and major hurricanes: 2.
- Near-normal season: neither above-normal nor below normal
- Below-normal season: An ACE value below 66 (71.4% of the 1981–2010 median), or none of the following three parameters are exceeded: number of tropical storms: 9, hurricanes: 4, and major hurricanes: 1.
The term hyperactive is used by Goldenberg et al. (2001)[5] based on a different weighting algorithm[6] which places more weight on major hurricanes, but typically equating to an ACE of about 153 (175% of the 1951–2000 median).
Individual storms
The highest ever ACE estimated for a single storm in the Atlantic is 73.6, for Hurricane San Ciriaco in 1899. This single storm had an ACE higher than many whole Atlantic storm seasons. Other Atlantic storms with high ACEs include Hurricane Ivan in 2004, with an ACE of 70.4, Hurricane Donna in 1960, with an ACE of 64.6, Hurricane Isabel in 2003 with an ACE of 63.28, and the Great Charleston Hurricane of 1893 with an ACE of 63.5.
Atlantic hurricane seasons, 1950–2014
For the in-progress season, the ACE is preliminary based on National Hurricane Center bulletins, which may later be revised.
East Pacific ACE
Accumulated Cyclone Energy is also used in the eastern and central Pacific Ocean. Data on ACE is considered reliable starting with the 1971 season. The season with the highest ACE since 1971 is the 1992 season. The 1977 season has the lowest ACE. The most recent above-normal season is the 2014 season, the most recent near-normal season is the 2012 season, and the most recent below normal season is the 2013 season.[7] The 35 year median 1971–2005 is 115 x 104kn2 (100 in the EPAC zone east of 140°W, 13 in the CPAC zone); the mean is 130 (112 + 18).
The (unofficial) categorisation of seasons for this table is based mutatis mutandis on that used in the Atlantic basin:
- Above-normal season: An ACE value above 135 (117% of the median), provided at least two of the following three parameters exceed the long-term average: number of tropical storms (16), hurricanes (9), and major hurricanes (4).
- Near-normal season: neither above-normal nor below normal
- Below-normal season: An ACE value below 86 (75% of the median)
See also
- List of Atlantic hurricane seasons
- List of Pacific hurricane seasons
References
- ↑ Mark Saunders, Adam Lea (2007). "Summary of 2006 NW Pacific Typhoon Season and Verification of Authors’ Seasonal Forecasts" (PDF). Tropical Storm Risk. Retrieved 2013-09-01.
- ↑ Last advisory for T.S. Zeta 2005
- ↑ Bell GD, Halpert MS, Schnell RC et al. (2000). "Climate Assessment for 1999" (PDF). Bulletin of the American Meteorological Society 81 (6): 1328. Bibcode:2000BAMS...81.1328B. doi:10.1175/1520-0477(2000)081<1328:CAF>2.3.CO;2.
- ↑ Climate Prediction Center (May 22, 2014). "Background information: the North Atlantic Hurricane Season". United States National Oceanic and Atmospheric Administration. Retrieved June 5, 2014.
- ↑ Goldberg SB, Landsea CW, Mestas-Nuñez AM, Gray WM (July 2001). "The Recent Increase in Atlantic Hurricane Activity: Causes and Implications" (PDF). Science 293 (5529): 474–9. Bibcode:2001Sci...293..474G. doi:10.1126/science.1060040. PMID 11463911.
Supplementary material
- ↑ Summary of 2000 Atlantic tropical cyclone activity and verification of authors’ seasonal activity prediction.
- ↑ East North Pacific ACE (through 30 Nov. 2005)
External links
- NOAA ACE by year from 1851
- National Climatic Data Center — Atlantic Basin 2004 Accumulated Cyclone Energy (ACE) Index
- National Climatic Data Center — Atlantic Basin 2005 Accumulated Cyclone Energy (ACE) Index
- 2004 Pacific NW Typhoon Season ACE pdf
- Global Tropical Cyclone Best Track Database
- Hurricane Metrics