2005–06 South Pacific cyclone season
| |
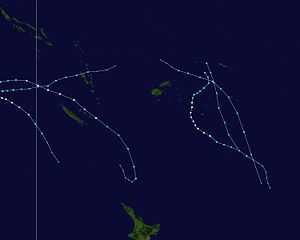
| Season summary map |
| First system formed |
November 30, 2005 |
| Last system dissipated |
April 21, 2006 |
| Strongest storm |
Wati – 950 hPa (mbar), 155 km/h (100 mph) (10-minute sustained) |
| Total depressions |
15 |
| Tropical cyclones |
5 |
| Severe tropical cyclones |
3 |
| Total fatalities |
None Reported |
| Total damage |
$26,000 (2006 USD) |
South Pacific tropical cyclone seasons
2003–04, 2004–05, 2005–06, 2006–07, 2007–08 |
| Related articles |
|
|
The 2005–06 South Pacific cyclone season was an event in the annual cycle of tropical cyclone formation. It began on November 1, 2005 and ended on April 30, 2006. These dates conventionally delimit the period of each year when most tropical cyclones form in the southern Pacific Ocean east of 160°E. Additionally, the regional tropical cyclone operational plan defines a tropical cyclone year separately from a tropical cyclone season, and the "tropical cyclone year" runs from July 1, 2005 to June 30, 2006.[1]
Tropical cyclones between 160°E and 120°W and north of 25°S are monitored by the Fiji Meteorological Service in Nadi. Those that move south of 25°S are monitored by the Tropical Cyclone Warning Centre in Wellington, New Zealand.[1]
Seasonal forecasts
Source
Record | Tropical
Cyclone | Severe
Tropical Cyclone | Ref |
| Record high: | 1997–98:16 | 1982–83:10 | [2] |
| Record low: | 2003–04: 3 | 1994-95: 1 | [2] |
| RSMC Nadi | 7–9 | - | [3] |
| Activity during the season: | 5 | 3 |
During October 2005, both RSMC Nadi and New Zealand's National Institute of Water and Atmospheric Research issued seasonal forecasts which contained information on what was expected to occur during the 2005-06 tropical cyclone season. Both agencies expected that the season would see a near average amount of tropical cyclone activity due there being no El Niño or La Nina. As a result of these conditions RSMC Nadi predicted that between 7-9 tropical cyclones would develop while NIWA did not predict how many tropical cyclone there would be during the season. RSMC Nadi also reported that Fiji had a higher chance of being hit by a tropical cyclone this season than during recent previous seasons. NIWA also predicted that there was an average risk of a tropical cyclone coming within 550 km (340 mi), of: Fiji, Tonga, Niue, Vanuatu, New Caledonia, Wallis and Futuna, the Southern Cook Islands, Samoa, and New Zealand.[3][4]
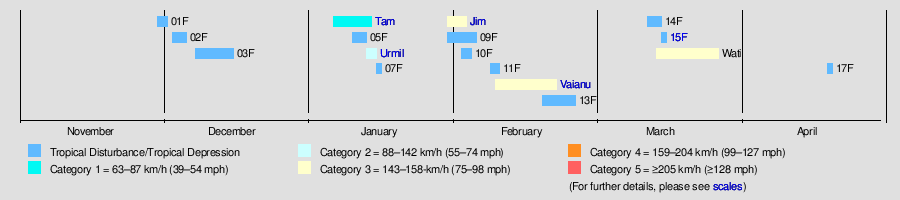
Seasonal summary
Storms
Tropical Depression 01F
| Tropical depression (Australian scale) |
|
|
| Duration |
November 30 – December 2 |
| Peak intensity |
Winds unknown 1005 mbar (hPa) |
Formed on November 30 and dissipated on December 2, 2005.
Tropical Depression 02F
| Tropical depression (Australian scale) |
|
|
| Duration |
December 3 – December 6 |
| Peak intensity |
Winds unknown 1002 mbar (hPa) |
Formed on December 3 and dissipated on December 6, 2005.
Tropical Depression 03F
| Tropical depression (Australian scale) |
|
|
| Duration |
December 8 – December 16 |
| Peak intensity |
35 km/h (25 mph) (10-min) 1001 mbar (hPa) |
Formed on December 8 and dissipated on December 18, 2005.
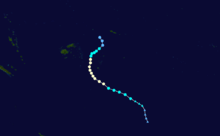
Tropical Cyclone Tam
| Category 1 tropical cyclone (Australian scale) |
| Tropical storm (SSHWS) |
|
|
| Duration |
January 6 – January 14 |
| Peak intensity |
85 km/h (50 mph) (10-min) 987 mbar (hPa) |
Tam originated as Tropical Depression 04F near 15°S 179.5°E on January 6. The system then lingered around for a few days, appearing to significantly weaken, only to strengthen later. As Tam moved southeastward on January 12, a gale warning was issued for Tonga and later for Niue as well as American Samoa. Tam accelerated towards south-southeast and became extratropical on January 14. Tam was the first tropical cyclone to occur within the area of responsibility of TCWC Wellington this year.
Tropical Depression 05F
| Tropical depression (Australian scale) |
|
|
| Duration |
January 10 – January 13 |
| Peak intensity |
55 km/h (35 mph) (10-min) 996 mbar (hPa) |
Formed on January 10 and dissipated on January 13, 2006.
Tropical Cyclone Urmil
| Category 2 tropical cyclone (Australian scale) |
| Tropical storm (SSHWS) |
|
|
| Duration |
January 13 – January 15 |
| Peak intensity |
110 km/h (70 mph) (10-min) 975 mbar (hPa) |
The second named storm of the season formed out of a weak tropical disturbance on January 13.[5] Later that day, the RSMC in Nadi began issuing advisories on the system and classified it as Tropical Depression 06F while located about 370 km (230 mi) west of Pago Pago, American Samoa. With favorable environmental conditions in the wake of Tropical Cyclone Tam, the depression rapidly organized, strengthening into a Category 1 cyclone six hours after the first advisory was issued and was given the name Urmil.[5][6] Several hours later, the JTWC also began issuing advisories on Urmil, designating it as Tropical Cyclone 07P.[7] On January 14, Urmil underwent a brief period explosive deepening,[6] attaining its peak intensity of 110 km/h (70 mph 10-min).[5] Not long after reaching its peak, increased wind shear, cooler waters, and faster forward motion caused the storm to weaken. By January 15, Urmil transitioned into an extratropical cyclone. Later that day, the remnants of the storm were absorbed into the mid-latitude westerlies.[6]
Tropical Cyclone Urmil had little impact on land, with gale-force winds being felt only in Tonga.[8] Heavy rains exaggerated flooding produced by Cyclone Tam earlier in January and caused minor crop damages.[9][10]
Tropical Depression 07F
| Tropical depression (Australian scale) |
|
|
| Duration |
January 15 – January 16 |
| Peak intensity |
30 km/h (15 mph) (10-min) |
The seventh depression of the season developed on January 15 as Urmil was dissipating. A weak system, 07F formed out of a slow moving tropical disturbance about 790 km (490 mi) north of Fiji. The system peaked in intensity with winds of 30 km/h (15 mph) later that day. On January 16, the low dissipated about 325 km (200 mi) west-northwest of Fiji.[6]
Severe Tropical Cyclone Jim
| Category 3 severe tropical cyclone (Australian scale) |
| Category 1 tropical cyclone (SSHWS) |
|
|
| Duration |
January 30 – February 3 |
| Peak intensity |
150 km/h (90 mph) (10-min) 955 mbar (hPa) |
Cyclone Jim originated in the Australian region, and moved into Fiji's area of responsibility on January 30. Jim gradually turned south-southeastward and became extratropical on February 1.
The extratropical remnants of Jim (08F) lingered around and then moved northwest. On February 3, 08F was again mentioned in a bulletin issued by Fiji. However, on the following day, the number 08F was dropped in Fiji bulletin while Brisbane called it a tropical low instead of Ex-Jim. The low was quasi-stationary and gradually weaken afterwards. It is questionable whether this system is a continuation of Jim.
Despite being well to the west of that country, Cyclone Jim was blamed for extensive flooding in Fiji, with the western coast of the island of Viti Levu – including the city of Lautoka – inundated by floodwaters on January 29.[11] No fatalities were reported in any of the areas affected by the cyclone.
Tropical Depression 09F
| Tropical depression (Australian scale) |
|
|
| Duration |
January 30 – January 30 |
| Peak intensity |
Winds unknown 994 mbar (hPa) |
Early on January 30, RSMC Nadi reported that Tropical Depression 09F had formed about 230 km, (145 mi), to the northeast of New Caledonia.[6] As the convection was detached from the low level circulation center, and was being steered into an environment of increasing vertical windshear, RSMC Nadi immediately issued their final advisory on the system.[12]
Tropical Depression 10F
| Tropical depression (Australian scale) |
|
|
| Duration |
February 2 – February 4 |
| Peak intensity |
55 km/h (35 mph) (10-min) 998 mbar (hPa) |
The tenth depression of the season formed on February 2 about 150 km (95 mi) southwest of Niue. High wind shear prevented significant strengthening,[13] with winds peaking at 55 km/h (35 mph) and a minimum pressure of 998 hPa (mbar).[14] Tracking in an erratic, southerly direction, the depression slowly weakened as convection was displaced by wind shear. Tropical Depression 10F was last monitored on February 4 about 740 km (460 mi) southeast of Tongatapu.[13]
Tropical Depression 11F
| Tropical depression (Australian scale) |
|
|
| Duration |
February 8 – February 10 |
| Peak intensity |
35 km/h (25 mph) (10-min) |
Formed on February 8 and dissipated on February 10, 2006.
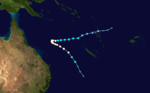
Severe Tropical Cyclone Vaianu
| Category 3 severe tropical cyclone (Australian scale) |
| Category 1 tropical cyclone (SSHWS) |
|
|
| Duration |
February 9 – February 22 |
| Peak intensity |
130 km/h (80 mph) (10-min) 965 mbar (hPa) |
Tropical Depression 12F formed near 14.5°S 176.1°W on February 10 and a tropical cyclone alert was raised in Tonga. This is the third tropical system to threaten Tonga this season. At that time, another Tropical Depression (11F) was to its south causing unstable movements of the two depressions. On the next day, 12F became the dominant system and moved south. Strengthening into Tropical Cyclone Vaianu, it turned southwest and passed between Fiji and Tonga. On February 13, Vaianu resumed a southward track and reached hurricane intensity. Vaianu then struck the Tonga islands as a Category 1 cyclone on the Saffir-Simpson scale, knocking down power lines and flattening crops, such as banana and mango trees. In Nukuʻalofa, low lying areas were shut down because of flooding. On February 13, Vaianu reached its peak intensity of 85 mp/h, but these peak winds were well away from the Tonga and Fiji islands, but Tonga still felt Vaianu's winds. Then, the cyclone accelerated towards the southeast, entered TCWC Wellington's area of responsibility and became extratropical on February 16.
Tropical Depression 13F
| Tropical depression (Australian scale) |
|
|
| Duration |
February 19 – February 26 |
| Peak intensity |
35 km/h (25 mph) (10-min) |
Formed on February 19 and dissipated on February 26, 2006.
Tropical Depression 14F
| Tropical depression (Australian scale) |
|
|
| Duration |
March 13 – March 16 |
| Peak intensity |
35 km/h (25 mph) (10-min) |
Formed on March 13 and dissipated on March 16, 2006.
Tropical Depression 15F (Larry)
| Tropical depression (Australian scale) |
|
|
| Duration |
March 16 – March 17 (Crossed 160°E) |
| Peak intensity |
55 km/h (35 mph) (10-min) 1000 mbar (hPa) |
Main article:
Cyclone LarryThe tropical depression which would eventually become one of the costliest disasters in Australian history formed on March 16 near the eastern edge of RSMC Nadi's area of responsibility.[15] The depression, given the designation 15F, attained winds of 55 km/h (35 mph) before crossing into the area of responsibility of the Tropical Cyclone Warning Center in Brisbane, Australia.[16] Shortly after, the depression was upgraded to a Tropical Cyclone and named Larry. The storm continued to intensify, becoming a Severe Tropical Cyclone before making landfall near Innisfail, Queensland, where it caused widespread damage.[15]
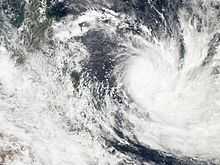
Severe Tropical Cyclone Wati
| Category 3 severe tropical cyclone (Australian scale) |
| Category 1 tropical cyclone (SSHWS) |
|
|
| Duration |
March 17 – March 28 |
| Peak intensity |
155 km/h (100 mph) (10-min) 955 mbar (hPa) |
Tropical Depression 16F formed on March 17 and strengthened into Tropical Cyclone Wati on March 19 north of New Caledonia. It moved westwards and slowly strengthened into a Category 3 cyclone on the Australian scale before coming to a near standstill over the Coral Sea. After remaining stationary for most of March 22, Wati took a southeasterly course on March 23, gaining speed and continuing that course on March 24. A cyclone watch was issued for Lord Howe Island and a cyclone warning was issued for Norfolk Island. Wati passed between the two islands and became extratropical on March 25.
The remains of Wati brought heavy rain and strong winds to the North Island of New Zealand on March 26, with gusts of 140 km/h reported at Cape Reinga.[17]
Tropical Depression 17F
| Tropical depression (Australian scale) |
|
|
| Duration |
April 20 – April 21 |
| Peak intensity |
Winds unknown 1005 mbar (hPa) |
Late on April 20, RSMC Nadi reported that Tropical Depression 17F had formed about 500 km (310 mi), to the southeast of Suva, Fiji. As a result of strong environmental shear over the system, the low level circulation center was weak and exposed with deep convection displaced to the south of the center. RSMC Nadi then issued their final advisory on the system late the next day.[18][19]
See also
References
- ↑ 1.0 1.1 "Tropical Cyclone Operational Plan for the South Pacific and South-East Indian Ocean" (PDF). WMO. 2006. Archived (PDF) from the original on 11 September 2008. Retrieved August 15, 2008.
- ↑ 2.0 2.1 Climate Services Division (October 26, 2010). Tropical Cyclone Guidance for Season 2010/11 for the Fiji and the Southwest Pacific (Report). Fiji Meteorological Service. Archived from the original (PDF) on February 27, 2012. Retrieved April 6, 2012.
- ↑ 3.0 3.1 Climate Services Division (November 1, 2005). Fiji Islands Weather Summary October 2005 Volume:5/26 Issue:5 (PDF) (Report). Fiji Meteorological Service. p. 5. Archived from the original on August 1, 2011. Retrieved August 1, 2011.
- ↑ Salinger, Jim; Burgess, Stuart; Renwick, Jim (2005). "Tropical cyclone guidance for the 2005/06 season". Island Climate Update (National Institute of Water and Atmospheric Research) 61 (October 2005). Archived from the original on August 1, 2011. Retrieved August 1, 2011.
- ↑ 5.0 5.1 5.2 Fiji Meteorological Service (2006). "Tropical Cyclone Summary: 2005–2006 Season" (PDF). World Meteorological Organization. Retrieved May 12, 2009.
- ↑ 6.0 6.1 6.2 6.3 6.4 Gary Padgett (April 25, 2006). "Monthly Tropical Weather Summary for January 2006". Typhoon 2000. Archived from the original on 24 February 2009. Retrieved March 11, 2009.
- ↑ Joint Typhoon Warning Center (January 16, 2006). "JTWC Advisories for Tropical Cyclone 07P (Urmil)". Australia Severe Weather. Retrieved March 11, 2009.
- ↑ Kevin Vang (January 14, 2006). "Cyclone Urmil develops from Tropical Depression 06F; Urmil over Tafahi and Niuatoputapu". AFAP Asia-Pacific Disaster Alerts. Retrieved March 11, 2009.
- ↑ Staff Writer (January 16, 2006). "Cyclones cause minimal damage to Niuatoputapu in northern Tonga". Radio New Zealand. Retrieved March 11, 2009.
- ↑ Staff Writer (January 27, 2006). "Hurricanes fizzle out in Samoa, where some of the policemen wear skirts". Lohontan Valley News. Retrieved March 11, 2009.
- ↑ http://www.pacificislands.cc/pina/pinadefault2.php?urlpinaid=19927
- ↑ "Severe Weather Warnings issued on 2006-01-30". MT Archive. January 30, 2006. Retrieved March 31, 2010.
- ↑ 13.0 13.1 Gary Padgett (May 2, 2006). "Monthly Tropical Weather Summary for February 2006". Typhoon 2000. Retrieved May 13, 2009.
- ↑ Gary Padgett (March 13, 2006). "Monthly Tropical Cyclone Tracks for February 2006". Typhoon 2000. Retrieved May 13, 2009.
- ↑ 15.0 15.1 Gary Padgett (July 17, 2006). "Monthly Tropical Weather Summary for March 2006". Typhoon 2000. Retrieved May 13, 2009.
- ↑ Gary Padgett (March 31, 2006). "Monthly Tropical Cyclone Tracks for March 2006". Typhoon 2000. Retrieved May 13, 2009.
- ↑ zBeston, Anne (March 27, 2006). "Cyclone Wati lashes out at North Island". NZ Herald News. Retrieved February 15, 2009.
- ↑ "Severe Weather Warnings issued on 2006-04-20". MT Archive. April 20, 2006. Retrieved March 31, 2010.
- ↑ "Severe Weather Warnings issued on 2006-04-21". MT Archive. April 21, 2006. Retrieved March 31, 2010.
External links
|
|---|
| | | |
-
 Book Book
-
 Category Category
-
 Portal Portal
-
 WikiProject WikiProject
-
 Commons Commons
|
|
| 2000–2009 South Pacific cyclone seasons |
|---|
| |
|


.jpg)