1946 Atlantic hurricane season
| |
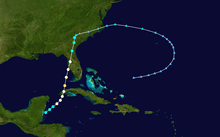
| Season summary map |
| First system formed |
June 13, 1946 |
| Last system dissipated |
November 3, 1946 |
| Strongest storm |
Four and "Florida" – 977 mbar (hPa) (28.86 inHg), 100 mph (155 km/h) (1-minute sustained) |
| Total storms |
7 |
| Hurricanes |
3 |
| Major hurricanes (Cat. 3+) |
0 |
| Total fatalities |
5 |
| Total damage |
$5.2 million (1946 USD) |
Atlantic hurricane seasons
1944, 1945, 1946, 1947, 1948 |
The 1946 Atlantic hurricane season officially began on June 16, 1946,[1] and lasted until November 15, 1946. These dates conventionally delimit the period of each year when most tropical cyclones form in the Atlantic basin.
The 1946 season was fairly quiet, with seven storms forming, of which three became hurricanes. There were no major hurricanes, though a minimal hurricane hit the Tampa Bay area more specifically St. Petersburg. Damage was relatively minimal and confined to a small area where the eyewall passed over.
Storms
Tropical Storm One
| Tropical storm (SSHWS) |
|
|
| Duration |
June 13 – June 16 |
| Peak intensity |
40 mph (65 km/h) (1-min) ≤ 1014 mbar (hPa) |
A minimal tropical storm, first detected on June 13, moved across the northern Gulf of Mexico. It weakened to a tropical depression before hitting near the Texas/Louisiana border on June 16, causing no damage. It may have remained a tropical depression throughout its lifespan but data was inconclusive.[2]
Hurricane Two
| Category 1 hurricane (SSHWS) |
|
|
| Duration |
July 5 – July 10 (Extratropical on July 9) |
| Peak intensity |
80 mph (130 km/h) (1-min) ≤ 1005 mbar (hPa) |
A small tropical storm over the western Atlantic made landfall near Oak Island, North Carolina, on July 6. Winds at landfall were close to 50 mph (80 km/h).[2] It turned northeastward, became a hurricane, and became extratropical at 00 UTC on July 9. It dissipated on July 10. Some property damage occurred, but no deaths were reported.
Tropical Storm Three
| Tropical storm (SSHWS) |
|
|
| Duration |
August 25 – August 26 |
| Peak intensity |
40 mph (65 km/h) (1-min) |
On August 25, a tropical storm formed in the Bay of Campeche. It moved quickly westward, hitting near Tampico, Tamaulipas, the next day and dissipating.
Hurricane Four
| Category 2 hurricane (SSHWS) |
|
|
| Duration |
September 12 – September 17 (Extratropical on September 15) |
| Peak intensity |
100 mph (155 km/h) (1-min) 975 mbar (hPa) |
A low-pressure area became a tropical storm on September 12 over the Bahamas and a hurricane the next day while moving northeastward. After peaking as a Category 2 hurricane, the hurricane weakened and became extratropical on September 15 south of Nova Scotia. The system dissipated on September 17. When the radar image was taken, it was only the third time in history that a hurricane passed close enough to a radar site to reveal its structure.[2]
Tropical Storm Five
| Tropical storm (SSHWS) |
|
|
| Duration |
October 1 – October 6 (Extratropical on October 3) |
| Peak intensity |
60 mph (95 km/h) (1-min) ≤ 1004 mbar (hPa) |
Hurricane Six
| Category 2 hurricane (SSHWS) |
|
|
| Duration |
October 5 – October 14 (Extratropical on October 9) |
| Peak intensity |
100 mph (155 km/h) (1-min) ≤ 977 mbar (hPa) |
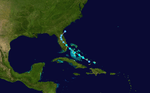
A tropical storm formed in the western Caribbean Sea on October 5. It moved northeastward, reaching hurricane strength the next day and hitting western Cuba on October 7 with winds of 80 mph (130 km/h). It intensified over the southeastern Gulf of Mexico to a Category 2 hurricane, but weakened slightly shortly before making landfall on Cortez in the Tampa Bay Area of Florida on October 8.[2] After moving inland, it became extratropical over North Carolina on October 9 and continued southeastward into the western Atlantic. The hurricane caused a total of $5.2 million in damage (1946 dollars), mostly from damage to the citrus crop. In addition, five lives were lost in Cuba.
Tropical Storm Seven
| Tropical storm (SSHWS) |
|
|
| Duration |
October 31 – November 3 |
| Peak intensity |
45 mph (75 km/h) (1-min) 1002 mbar (hPa) |
A tropical wave developed into a tropical storm north of Hispaniola on October 31. It moved west-northwestward, and made landfall on November 2 near Lake Worth in South Florida.[2] Moderate damage was associated from this tropical storm as heavy flooding disrupted fall planting.
Season effects
1946 North Atlantic tropical cyclone statistics
Storm
name |
Dates active |
Storm category
at peak intensity |
Max 1-min
wind
mph (km/h) |
Min.
press.
(mbar) |
Areas affected |
Damage
(millions USD) |
Deaths
|
| One |
June 13 – 17 |
Tropical storm |
40 (65) |
N/A |
United States Gulf Coast |
None |
0
|
| Two |
July 5 – 9 |
Category 1 hurricane |
80 (130) |
N/A |
North Carolina |
None |
0
|
| Three |
August 25 – 26 |
Tropical storm |
40 (65) |
N/A |
Mexico |
None |
0
|
| Depression |
September 9 – 10 |
Tropical depression |
N/A |
N/A |
Central America |
None |
0
|
| Four |
September 12 – 15 |
Category 2 hurricane |
100 (155) |
975 |
Bahamas, Atlantic Canada |
None |
0
|
| Five |
October 1 – 3 |
Tropical storm |
60 (95) |
N/A |
Azores |
None |
0
|
| Six |
October 5 – 9 |
Category 2 hurricane |
100 (155) |
977 |
Cuba, Southeast United States |
5.2 |
5
|
| Seven |
October 31 – November 3 |
Tropical storm |
45 (75) |
1002 |
Southeast United States |
None |
0 |
| Season Aggregates |
| 7 cyclones |
June 13 – November 3 |
| 100 (155) |
975 |
|
5.2 |
5 |
See also
References
External links
|
|---|
| | | |
-
 Book Book
-
 Category Category
-
 Portal Portal
-
 WikiProject WikiProject
-
 Commons Commons
|
|