Österbybruk
| Österbybruk | |
|---|---|
|
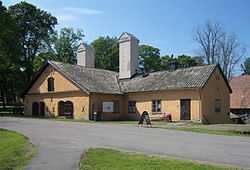
Walloon forge in Österbybruk | |
 Österbybruk | |
| Coordinates: 60°12′N 17°54′E / 60.200°N 17.900°ECoordinates: 60°12′N 17°54′E / 60.200°N 17.900°E | |
| Country | Sweden |
| Province | Uppland |
| County | Uppsala County |
| Municipality | Östhammar Municipality |
| Area[1] | |
| • Total | 2.51 km2 (0.97 sq mi) |
| Population (31 December 2010)[1] | |
| • Total | 2,272 |
| • Density | 904/km2 (2,340/sq mi) |
| Time zone | CET (UTC+1) |
| • Summer (DST) | CEST (UTC+2) |
Österbybruk is a locality situated in Östhammar Municipality, Uppsala County, Sweden with 2,272 inhabitants in 2010.[1]
Ironworks
The Österby works was one of a number mostly in Roslagen, where there were Wallon forges, producing high quality oregrounds iron for export. Österby's brand mark was OO. All iron was branded with that mark. The Österby ironproducts were highly valued in England for the production of blister steel by the cementation process.
Climate
| Climate data for Österbybruk, 2010-2012 | |||||||||||||
|---|---|---|---|---|---|---|---|---|---|---|---|---|---|
| Month | Jan | Feb | Mar | Apr | May | Jun | Jul | Aug | Sep | Oct | Nov | Dec | Year |
| Record high °C (°F) | 10.0 (50) |
11.9 (53.4) |
17.7 (63.9) |
27.4 (81.3) |
28.6 (83.5) |
30.6 (87.1) |
34.4 (93.9) |
30.7 (87.3) |
27.6 (81.7) |
20.6 (69.1) |
14.4 (57.9) |
11.3 (52.3) |
34.4 (93.9) |
| Average high °C (°F) | −2.6 (27.3) |
−2.4 (27.7) |
2.3 (36.1) |
10.5 (50.9) |
16.2 (61.2) |
19.7 (67.5) |
23.0 (73.4) |
20.8 (69.4) |
15.9 (60.6) |
9.4 (48.9) |
4.4 (39.9) |
−1.5 (29.3) |
9.64 (49.35) |
| Daily mean °C (°F) | −5.5 (22.1) |
−6.6 (20.1) |
0.1 (32.2) |
5.2 (41.4) |
10.5 (50.9) |
14.3 (57.7) |
17.9 (64.2) |
15.6 (60.1) |
11.3 (52.3) |
5.4 (41.7) |
1.7 (35.1) |
−4.2 (24.4) |
5.48 (41.85) |
| Average low °C (°F) | −8.8 (16.2) |
−11.4 (11.5) |
−3.8 (25.2) |
0.3 (32.5) |
4.2 (39.6) |
8.2 (46.8) |
12.8 (55) |
10.3 (50.5) |
7.0 (44.6) |
1.7 (35.1) |
−0.9 (30.4) |
−7.7 (18.1) |
0.99 (33.79) |
| Record low °C (°F) | −34.0 (−29.2) |
−30.4 (−22.7) |
−27.3 (−17.1) |
−13.8 (7.2) |
−5.6 (21.9) |
−2.0 (28.4) |
1.0 (33.8) |
−1.0 (30.2) |
−4.7 (23.5) |
−15.6 (3.9) |
−20.9 (−5.6) |
−32.4 (−26.3) |
−34.0 (−29.2) |
References
- ↑ 1.0 1.1 1.2 "Tätorternas landareal, folkmängd och invånare per km2 2005 och 2010" (in Swedish). Statistics Sweden. 14 December 2011. Archived from the original on 10 January 2012. Retrieved 10 January 2012.
| ||||||