South Australian House of Assembly
| House of Assembly | |
|---|---|
 | |
| Type | |
| Type | Lower house of the Parliament of South Australia |
| History | |
| Founded | 1857 |
| Leadership | |
| Speaker |
Michael Atkinson, Labor Since 5 February 2013 |
| Deputy Speaker |
Michael Wright, Labor Since 5 February 2013 |
| Structure | |
| Seats | 47 |
| Political groups |
Government Labor (26) Opposition Liberal (18) Crossbench Independent (3) |
| Meeting place | |
 | |
|
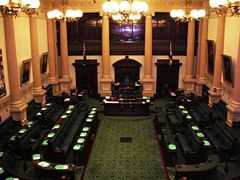
House of Assembly Chamber, Parliament House, Adelaide, South Australia, Australia | |
| Website | |
| SA House of Assembly | |


The House of Assembly, or lower house, is one of the two chambers of the Parliament of South Australia. The other is the Legislative Council. It sits in Parliament House in the state capital, Adelaide.
As of the 2010 election, the lower house consists of 26 Labor, 18 Liberal and 3 independent.
Overview
The House of Assembly was created in 1857, when South Australia attained self-government. The development of an elected legislature — although only men could vote — marked a significant change from the prior system, where legislative power was in the hands of the Governor and the Legislative Council, which was appointed by the Governor.
In 1894, the House of Assembly granted women the right to vote — the second place in the world to do so after New Zealand in 1893- and the first to allow women to stand for election.
The House of Assembly has had 47 members since 1970, each coming from a single-member constituency. These are commonly known as seats, and are intended to represent approximately the same population in each electorate. Voting is by preferential voting with complete preference allocation, as with the equivalent federal chamber, the Australian House of Representatives. All members face re-election approximately every four years. The most recent election was held on 20 March 2010.
Most legislation is initiated in the House of Assembly. The party or coalition with the most seats in the lower house is invited by the Governor to form government. The leader of that party becomes Premier of South Australia, and their senior colleagues become ministers responsible for various portfolios. As Australian major party MPs almost always vote along party lines, almost all legislation introduced by the governing party will pass through the House of Assembly.
As with the federal parliament and Australian other states and territories, voting in the Assembly is compulsory for all those over the age of 18. Voting in the House of Assembly had originally been voluntary, but this was changed in 1942.
Election result summaries
| 1857 | 1860 | 1862 | 1865 | 1868 | 1870 | 1871 | 1875 | 1878 | 1881 | 1884 | 1887 | 1890 | ||||
|---|---|---|---|---|---|---|---|---|---|---|---|---|---|---|---|---|
| Parliament | 1 | 2 | 3 | 4 | 5 | 6 | 7 | 8 | 9 | 10 | 11 | 12 | 13 | |||
| Districts | 17 | 17 | 18 | 18 | 18 | 18 | 18 | 22 | 22 | 22 | 26 | 26 | 27 | |||
| Members | 36 | 36 | 36 | 36 | 36 | 36 | 36 | 46 | 46 | 46 | 52 | 52 | 54 |
| 1893 | 1896 | 1899 | 1902 | 1905 | 1906 | 1910 | 1912 | 1915 | 1918 | 1921 | 1924 | 1927 | ||||
|---|---|---|---|---|---|---|---|---|---|---|---|---|---|---|---|---|
| Parliament | 14 | 15 | 16 | 17 | 18 | 19 | 20 | 21 | 22 | 23 | 24 | 25 | 26 | |||
| Districts | 27 | 27 | 27 | 13 | 13 | 13 | 13 | 12 | 19 | 19 | 19 | 19 | 19 | |||
| Members | 54 | 54 | 54 | 42 | 42 | 42 | 42 | 40 | 46 | 46 | 46 | 46 | 46 | |||
| Cons. | 21 | 21 | 28 | 19 | ALP | 22 | 16 | 26 | 17 | ALP | 16 | 27 | 16 | |||
| Lib. | 23 | 15 | 14 | 12 | LDU | 20 | 24 | 20 | 28 | LU | 25 | 17 | 28 | |||
| ULP | 10 | 12 | 11 | 5 | 15 | FSP | 1 | FSP | 4 | |||||||
| Other | 6 | 1 | 6 | 27 | 1 | 2 | 2 |
| 1930 | 1933 | 1938 | 1941 | 1944 | 1947 | 1950 | 1953 | 1956 | 1959 | 1962 | 1965 | 1968 | ||||
|---|---|---|---|---|---|---|---|---|---|---|---|---|---|---|---|---|
| Parliament | 27 | 28 | 29 | 30 | 31 | 32 | 33 | 34 | 35 | 36 | 37 | 38 | 39 | |||
| Districts | 19 | 19 | 39 | 39 | 39 | 39 | 39 | 39 | 39 | 39 | 39 | 39 | 39 | |||
| Members | 46 | 46 | 39 | 39 | 39 | 39 | 39 | 39 | 39 | 39 | 39 | 39 | 39 | |||
| ALP | 30 | 6 | 9 | 11 | 16 | 13 | 12 | 15 | 15 | 17 | 19 | 21 | 19 | |||
| LCL | 13 | 29 | 15 | 20 | 20 | 23 | 23 | 20 | 21 | 20 | 18 | 17 | 19 | |||
| Other | 3 | 11 | 15 | 8 | 3 | 3 | 4 | 4 | 3 | 2 | 2 | 1 | 1 |
| 1970 | 1973 | 1975 | 1977 | 1979 | 1982 | 1985 | 1989 | 1993 | 1997 | 2002 | 2006 | ||||
|---|---|---|---|---|---|---|---|---|---|---|---|---|---|---|---|
| Parliament | 40 | 41 | 42 | 43 | 44 | 45 | 46 | 47 | 48 | 49 | 50 | 51 | |||
| Members | 47 | 47 | 47 | 47 | 47 | 47 | 47 | 47 | 47 | 47 | 47 | 47 | |||
| ALP | 27 | 26 | 23 | 27 | 19 | 24 | 27 | 22 | 10 | 21 | 23 | 28 | |||
| LPA | 20 | 20 | 20 | 17 | 25 | 21 | 16 | 22 | 37 | 23 | 20 | 15 | |||
| LM/AD | 2 | 1 | 1 | Nat | 1 | 1 | 1 | 1 | 1 | 1 | |||||
| Other | 1 | 2 | 2 | 2 | 1 | 3 | 2 | 2 | 3 | 3 |
| 2010 | 2014 | 2018 | 2022 | 2026 | 2030 | 2034 | 2038 | 2042 | 2046 | 2050 | 2054 | 2058 | |||||
|---|---|---|---|---|---|---|---|---|---|---|---|---|---|---|---|---|---|
| Parliament | 52 | ||||||||||||||||
| Members | 47 | ||||||||||||||||
| ALP | 26 | ||||||||||||||||
| LPA | 18 | ||||||||||||||||
| Other | 3 |
Current distribution of seats
| Party | Seats held | ||||||||||||||||||||||||||
|---|---|---|---|---|---|---|---|---|---|---|---|---|---|---|---|---|---|---|---|---|---|---|---|---|---|---|---|
| 2010 | 2010–current | ||||||||||||||||||||||||||
| Australian Labor Party | 26 | ||||||||||||||||||||||||||
| Liberal Party of Australia | 18 | ||||||||||||||||||||||||||
| Independents | 3 | ||||||||||||||||||||||||||
Previous distributions of seats
2006–2010
| Party | Seats held | |||||||||||||||||||||||||||||
|---|---|---|---|---|---|---|---|---|---|---|---|---|---|---|---|---|---|---|---|---|---|---|---|---|---|---|---|---|---|---|
| 2006 | 2009 | 2009–2010 | ||||||||||||||||||||||||||||
| Australian Labor Party | 27 | 28 | ||||||||||||||||||||||||||||
| Liberal Party of Australia | 15 | 14 | ||||||||||||||||||||||||||||
| National Party of Australia | 1 | 1 | ||||||||||||||||||||||||||||
| Independents | 4 | 4 | ||||||||||||||||||||||||||||
- The Liberals were reduced from 15 to 14 seats when independent Geoff Brock was elected at the 2009 Frome by-election.
2002–2006
| Party | Seats held | ||||||||||||||||||||||||
|---|---|---|---|---|---|---|---|---|---|---|---|---|---|---|---|---|---|---|---|---|---|---|---|---|---|
| 2002 | 2003 | 2006 | 2006 | ||||||||||||||||||||||
| Australian Labor Party | 23 | 22 | 22 | ||||||||||||||||||||||
| Liberal Party of Australia | 20 | 20 | 20 | ||||||||||||||||||||||
| National Party of Australia | 1 | 1 | 1 | ||||||||||||||||||||||
| Greens | 1 | ||||||||||||||||||||||||
| Independents | 3 | 3 | 4 | ||||||||||||||||||||||
- Kris Hanna was elected as a Labor member in 2002, but defected first to the Greens and later became an independent.
1997–2002
| Party | Seats held | |||||||||||||||||||||||||||||||||||||||||||||||||||
|---|---|---|---|---|---|---|---|---|---|---|---|---|---|---|---|---|---|---|---|---|---|---|---|---|---|---|---|---|---|---|---|---|---|---|---|---|---|---|---|---|---|---|---|---|---|---|---|---|---|---|---|---|
| 1997 | 1997–1999 | 1999 | 2000 | 2001 | 2001–2002 | |||||||||||||||||||||||||||||||||||||||||||||||
| Liberal Party of Australia | 24 | 25 | 23 | 23 | ||||||||||||||||||||||||||||||||||||||||||||||||
| Australian Labor Party | 21 | 21 | 21 | 19 | ||||||||||||||||||||||||||||||||||||||||||||||||
| National Party of Australia | 1 | 1 | 1 | 1 | ||||||||||||||||||||||||||||||||||||||||||||||||
| Independents | 1 | 0 | 2 | 4 | ||||||||||||||||||||||||||||||||||||||||||||||||
- Mitch Williams was elected as an Independent Liberal member in 1997, but rejoined the Liberal Party in on 6 December 1999.
- Peter Lewis was expelled from the Liberal Party on 6 July 2000. He continued to sit in the Assembly as an independent.
- Bob Such resigned from the Liberal Party on 12 October 2000. He continued to sit in the Assembly as an independent.
- Murray De Laine resigned from the Labor Party on 15 August 2001. He continued to sit in the Assembly as an independent.
- Ralph Clarke, resigned from the Labor Party on 27 November 2001. He continued to sit in the Assembly as an independent.
1993–1997
| Party | Seats held | |||||||||||||||||||||||||||||||||||||
|---|---|---|---|---|---|---|---|---|---|---|---|---|---|---|---|---|---|---|---|---|---|---|---|---|---|---|---|---|---|---|---|---|---|---|---|---|---|---|
| 1993 | 1994 | 1994–1997 | ||||||||||||||||||||||||||||||||||||
| Liberal Party of Australia | 37 | 36 | ||||||||||||||||||||||||||||||||||||
| Australian Labor Party | 10 | 11 | ||||||||||||||||||||||||||||||||||||
- Labor were increased from 10 to 11 seats when Robyn Geraghty was elected at the 1994 Torrens by-election.
See also
- List of elections in South Australia
- List of South Australian state by-elections
- Members of the South Australian House of Assembly
- Parliaments of the Australian states and territories
- South Australian Electoral Districts (for the House of Assembly)
References
External links
| ||||||||
| |||||||||||||