Slope spectroscopy
Slope spectroscopy is a spectroscopic technique that is used to quantify concentrations of various compounds, proteins and antibodies in which the operating path length is varied and the absorbance is measured.
Equations
The Beer-Lambert law states that there is a logarithmic dependence between the transmission (or transmissivity), T, of light through a substance and the product of the absorption coefficient of the substance, α, and the distance the light travels through the material (i.e. the path length), ℓ. The absorption coefficient can, in turn, be written as a product of either a molar absorptivity of the absorber, ε, and the concentration c of absorbing species in the material, or an absorption cross section, σ, and the (number) density N of absorbers. (see Beer Lambert Law link for full derivation)

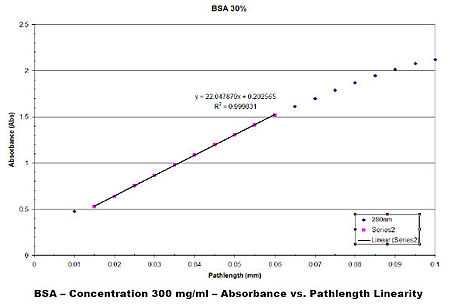
Slope spectroscopy takes advantage of Beer-Lambert law to determine concentrations of various solutions. By knowing the molar absorbtivity of the material and varying the path length, absorption can be plotted as a function of path length. See sample plot to the right:
By taking a linear regression of the linear plot above an expression relating Absorbance, A, slope, m, pathlength and concentration can be derived.
A linear equation of two variables can be derived,
by equating in terms of units we get,
Since the slope of the line is in units of Abs/Pathlength, slope can be expressed as,
by inserting into Beer’s Law we get,
This is the slope spectroscopy equation.
Applications
The slope spectroscopy technique can be applied in any situation where Beer’s law can be applied. It provides an analytical method that averages out minor variations in sample preparation consistency. It also provides a means to calculate concentrations without calibrations curves or serial dilution of samples.
Slope spectroscopy is typically used when highly reproducible data is a necessity. This can be in the fields of medicine, biotechnology, pharmacology, and drug discovery. It is particularly useful in the protein purification stage of biotechnology where accurate concentrations of various proteins are required or in crystallography.
Determining the relative ratio of protein to DNA is common practice and can be calculated by finding the slope at the corresponding absorption peaks and taking their ratio. This method is used to find the purity of a sample containing these two types of molecule.
Experimental methods
In ultraviolet-visible spectroscopy or spectroscopy in general a 1 cm pathlength cuvette is used to measure samples. The cuvette is filled with sample, light is passed through the sample and intensity readings are taken. The slope spectroscopy technique can be applied using the same methods as in absorption spectroscopy. With the advent of accurate linear stages, the slope spectroscopy technique is easily applied experimentally.
Other experimental methods include using ratios of slopes to build extinction coefficient spectra. This is possible because application of slope spectroscopy allows the scientist to keep concentration levels constant and vary path lengths.
Background subtraction

The slope spectroscopy technique uses a determined slope to calculate concentration. As stated above this is a product of the molar absorbtivity and the concentration. Since the actual absorbance value is taken at many data points at equal intervals, background subtraction is generally unnecessary. The image on the right is a linear plot showing both the background corrected data and the raw data.
This shows that the absorbance values on the plot are offset by an equal amount and the slope of the two plots are equal. Thus, the concentration calculated from the two plots is equal. Other scalar components that contribute to the absorbance of a given sample like contaminants on the cuvette or a different cuvette material also are averaged out during the slope measurement.
The Slope technique is also applicable for in line measurements for TFF and Chromatography applications
See also
- Applied spectroscopy
- Absorption spectroscopy
- Quantification of nucleic acids
- Polymer degradation
- Chromatography
- Forensic polymer engineering
- Society for Applied Spectroscopy
References
- Sarah A. Stewart and André J. Sommer, "Variable Path-Length Cells for Discovery-Based Investigation of the Beer-Lambert Law", Journal of Chemical Education, (1999)Vol 76, no. 3 pp 399
- Paul A. Flowers and Sherry-Ann Callender, "Variable Path Length Transmittance Cell for Ultraviolet, Viable and Infrared Spectroscopy and Spectroelectrochemistry", Anal. Chem. (1996), 68,199-201
- Thakkar SV, Allegre KM, Joshi SB, Volkin DB, Middaugh CR, "An application of ultraviolet spectroscopy to study interactions in protein solutions at high concentrations", J Pharm Sci. 2012 Sep;101(9):3051-61. doi: 10.1002/jps.23188, http://onlinelibrary.wiley.com/doi/10.1002/jps.23188/abstract
External links
Spectroscopy on the Open Directory Project


