SegReg
 Screenshot of graphics tab sheet SegReg | |
| Developer(s) | Institute for Land Reclamation and Improvement (ILRI) |
|---|---|
| Written in | Delphi |
| Operating system | Microsoft Windows |
| Available in | English |
| Type | Statistical software |
| License | Proprietary Freeware |
| Website | SegReg |
In statistics and data analysis the application software SegReg is a free and user-friendly tool for linear segmented regression analysis to determine the breakpoint where the relation between the dependent variable and the independent variable changes abruptly.[1]
Originally the method was developed for the analysis of the influence of soil salinity and depth of the watertable on growth of agricultural crops. However, it can be used for many other types of phenomena and relations, for example:
- the change of nutrient contents in plants with time [2]
- the number of negative indicator responses at 30% upstream riparian harvest [3]
- phosphorus and flow duration on the Saline River [4]
Features
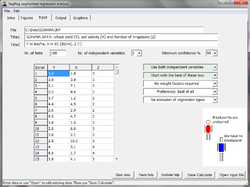
Screenprint of input tabsheet


SegReg permits the introduction of one or two independent variables. When two variables are used, it first determines the relation between the dependent variable and the most influential independent variable, where after it finds the relation between the residuals and the second independent variable. Residuals are the deviations of observed values of the dependent variable from the values obtained by segmented regression on the first independent variable.
The breakpoint is found numerically by adopting a series tentative breakpoints and performing a linear regression at both sides of them. The tentative breakpoint that provides the largest coefficient of determination (as a parameter for the fit of the regression lines to the observed data values) is selected as the true breakpoint. To assure that the lines at both sides of the breakpoint intersect each other exactly at the breakpoint, SegReg employs two methods and selects he method giving the best fit.
SegReg recognizes many types of relations and selects the ultimate type on the basis of statistical criteria like the significance of the regression coefficients. The SegReg output provides statistical confidence belts of the regression lines and a confidence block for the breakpoint.[5] The confidence level can be selected as 90%, 95% and 98% of certainty.
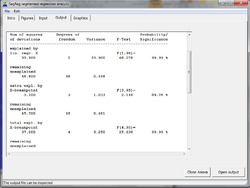
To complete the confidence statements, SegReg provides an analysis of variance and an Anova table.[6]
During the input phase, the user can indicate a preference for or an exclusion of a certain type. The preference for a certain type is only accepted when it is statistically significant, even when the significance of another type is higher.
ILRI [7] provides examples of application to magnitudes like crop yield, watertable depth, and soil salinity.
Equations
When only one independent variable is present, the results may look like:
- X < BP ==> Y = A1.X + B1 + RY
- X > BP ==> Y = A2.X + B2 + RY
where BP is the breakpoint, Y is the dependent variable, X the independent variable, A the regression coefficient, B the regression constant, and RY the residual of Y. When two independent variables are present, the results may look like:
- X < BPX ==> Y = A1.X + B1 + RY
- X > BPX ==> Y = A2.X + B2 + RY
- Z < BPZ ==> RY = C1.Z + D1
- Z > BPZ ==> RY = C2.Z + D2
where, additionally, BPX is BP of X, BPZ is BP of Z, Z is the second independent variable, C is the regression coefficient, and D the regression constant for the regression of RY on Z.
Substituting the expressions of RY in the second set of equations into the first set yields:
- X < BPX and Z < BPZ ==> Y = A1.X + C1.Z + E1
- X < BPX and Z > BPZ ==> Y = A1.X + C2.Z + E2
- X > BPX and Z < BPZ ==> Y = A2.X + C1.Z + E3
- X > BPX and Z > BPZ ==> Y = A2.X + C2.Z + E4
where E1 = B1+D1, E2 = B1+D2, E3 = B2+D1, and E4 = B2+D2 .
See also
| |||||||||||||||||||||||||
References
- ↑ Statistical principles of segmented regression with break-point
- ↑ Jung L.S., Eckstein R.L., Donath T.W. and Otte A. August 2011. A physiological approach to reduce population densities of Colchicum autumnale L. in extensively managed grasslands. In: Grassland Farming and Land Management Systems in Mountainous Regions, Vol. 16. or
- ↑ Lisa J. Nordin, David A. Maloney, and John F. Rex, 2009, Detecting effects of upper basin riparian harvesting at downstream reaches using stream indicators. In: BC Journal of Ecosystems and Management Vol 10, No. 2.
- ↑ Smoky Hill - saline basin total maximum daily load, Waterbody: Big Creek, Water Quality Impairment: total phosphorus.
- ↑ determination of the confidence interval of the break-point
- ↑ F-tests in the analysis of variance for segmented linear regression
- ↑ Drainage research in farmers' fields: analysis of data, 2002. Contribution to the project “Liquid Gold” of the International Institute for Land Reclamation and Improvement (ILRI), Wageningen, The Netherlands.
