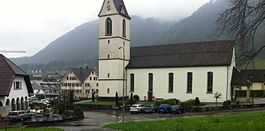
Schübelbach
| Schübelbach | ||||||||||
|---|---|---|---|---|---|---|---|---|---|---|
 | ||||||||||
| Population | 8,567 (Dec 2012)[1] | |||||||||
| - Density | 295 /km2 (765 /sq mi) | |||||||||
| Area | 29.01 km2 (11.20 sq mi)[2] | |||||||||
| Elevation | 433 m (1,421 ft) | |||||||||
| Postal code | 8862 | |||||||||
| SFOS number | 1346 | |||||||||
| Surrounded by | Benken (SG), Bilten (GL), Galgenen, Innerthal, Niederurnen (GL), Oberurnen (GL), Reichenburg, Tuggen, Vorderthal, Wangen | |||||||||
| Website | www.schübelbach.ch SFSO statistics | |||||||||
 Schübelbach | ||||||||||
| Location of Schübelbach
 | ||||||||||
Schübelbach is a municipality in March District in the canton of Schwyz in Switzerland.
Geography
Schübelbach has an area, as of 2006, of 29 km2 (11 sq mi). Of this area, 48.2% is used for agricultural purposes, while 42.8% is forested. Of the rest of the land, 6.3% is settled (buildings or roads) and the remainder (2.6%) is non-productive (rivers, glaciers or mountains).[3]
Demographics
Schübelbach has a population (as of 31 December 2012) of 8,567.[1] As of 2007, 25.1% of the population was made up of foreign nationals.[4] Over the last 10 years the population has grown at a rate of 12.8%. Most of the population (as of 2000) speaks German (85.0%), with Albanian being second most common ( 3.6%) and Serbo-Croatian being third ( 3.6%).[3]
As of 2000 the gender distribution of the population was 50.6% male and 49.4% female. The age distribution, as of 2008, in Schübelbach is; 2,040 people or 29.0% of the population is between 0 and 19. 2,146 people or 30.5% are 20 to 39, and 2,158 people or 30.7% are 40 to 64. The senior population distribution is 383 people or 5.4% are 65 to 74. There are 217 people or 3.1% who are 70 to 79 and 86 people or 1.22% of the population who are over 80. There are 2 people who are over 100 years old in Schübelbach.[4]
As of 2000 there are 2,692 households, of which 768 households (or about 28.5%) contain only a single individual. 224 or about 8.3% are large households, with at least five members.[4]
In the 2007 election the most popular party was the SVP which received 50.5% of the vote. The next three most popular parties were the CVP (15.2%), the FDP (15.1%) and the SPS (14.3%).[3]
In Schübelbach about 62.7% of the population (between age 25-64) have completed either non-mandatory upper secondary education or additional higher education (either university or a Fachhochschule).[3]
Schübelbach has an unemployment rate of 2.18%. As of 2005, there were 194 people employed in the primary economic sector and about 84 businesses involved in this sector. 883 people are employed in the secondary sector and there are 104 businesses in this sector. 1,072 people are employed in the tertiary sector, with 221 businesses in this sector.[3]
From the 2000 census, 4,474 or 63.6% are Roman Catholic, while 1,126 or 16.0% belonged to the Swiss Reformed Church. Of the rest of the population, there are 375 individuals (or about 5.33% of the population) who belong to the Orthodox Church, and there are less than 5 individuals who belong to another Christian church. There are 509 (or about 7.24% of the population) who are Islamic. There are 39 individuals (or about 0.55% of the population) who belong to another church (not listed on the census), 284 (or about 4.04% of the population) belong to no church, are agnostic or atheist, and 219 individuals (or about 3.12% of the population) did not answer the question.[4]
The historical population is given in the following table:[4]
| year | population |
|---|---|
| 1950 | 2,714 |
| 1960 | 3,206 |
| 1970 | 4,395 |
| 1980 | 4,633 |
| 1985 | 5,096 |
| 1990 | 6,232 |
| 2000 | 6,996 |
| 2005 | 7,557 |
| 2007 | 7,875 |
Transportation
Schübelbach-Buttikon railway station is a stop of the Zurich S-Bahn service S2, between Zurich and Ziegelbrücke.
References
- ↑ 1.0 1.1 Swiss Federal Statistics Office – STAT-TAB Ständige und Nichtständige Wohnbevölkerung nach Region, Geschlecht, Nationalität und Alter (German) accessed 29 August 2013
- ↑ Arealstatistik Standard - Gemeindedaten nach 4 Hauptbereichen
- ↑ 3.0 3.1 3.2 3.3 3.4 Swiss Federal Statistical Office accessed 02-Sep-2009
- ↑ 4.0 4.1 4.2 4.3 4.4 Canton Schwyz Statistics (German) accessed 27 August 2009
| Wikimedia Commons has media related to Schübelbach. |
| |||||||
