Neath (Assembly constituency)
| Welsh Assembly county constituency | |
|---|---|
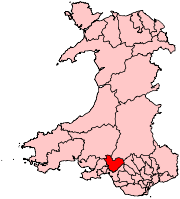 | |
| Neath shown as one of the 40 Welsh Assembly constituencies | |
| Created: | 1999 |
| Electoral region: | South Wales West |
| AM: | Gwenda Thomas |
| Party: | Labour |
| Preserved county: | West Glamorgan |
Neath is a constituency of the National Assembly for Wales. It elects one Assembly Member by the first past the post method of election. Also, however, it is one of seven constituencies in the South Wales West electoral region, which elects four additional members, in addition to seven constituency members, to produce a degree of proportional representation for the region as a whole.
Boundaries
The constituency was created for the first election to the Assembly, in 1999, with the name and boundaries of the Neath Westminster constituency. It is entirely within the preserved county of West Glamorgan.
The other six constituencies of the region are Aberavon, Bridgend, Gower, Ogmore, Swansea East and Swansea West.
Voting
In general elections for the National Assembly for Wales, each voter has two votes. The first vote may be used to vote for a candidate to become the Assembly Member for the voter's constituency, elected by the first past the post system. The second vote may be used to vote for a regional closed party list of candidates. Additional member seats are allocated from the lists by the d'Hondt method, with constituency results being taken into account in the allocation.
Elections
| Welsh Assembly Election 2011: Neath | |||||
|---|---|---|---|---|---|
| Party | Candidate | Votes | % | ±% | |
| Labour | Gwenda Thomas | 12,736 | 53.4 | +10.0 | |
| Plaid Cymru | Alun Llewellyn | 6,346 | 26.6 | −9.1 | |
| Conservative | Alex Powell | 2,780 | 11.7 | −0.1 | |
| BNP | Michael Green | 1,004 | 4.2 | N/A | |
| Liberal Democrats | Mathew McCarthy | 983 | 4.1 | −5.1 | |
| Majority | 6,390 | 26.8 | |||
| Turnout | 23849 | 41.1 | −2.4 | ||
| Labour hold | Swing | +9.6 | |||
| Welsh Assembly Election 2007: Neath[1] | |||||
|---|---|---|---|---|---|
| Party | Candidate | Votes | % | ±% | |
| Labour | Gwenda Thomas | 10,934 | 43.4 | −7.6 | |
| Plaid Cymru | Alun Llewellyn | 8,990 | 35.7 | +6.9 | |
| Conservative | Andrew Sivertsen | 2,956 | 11.7 | +2.6 | |
| Liberal Democrats | Mrs Sheila Ramsay-Waye | 2,320 | 9.2 | +0.0 | |
| Majority | 1,944 | 7.7 | |||
| Turnout | 25,200 | 43.5 | +4.4 | ||
| Labour hold | Swing | −7.3 | |||
| Welsh Assembly Election 2003: Neath[2] | |||||
|---|---|---|---|---|---|
| Party | Candidate | Votes | % | ±% | |
| Labour | Gwenda Thomas | 11,332 | 51.1 | +5.6 | |
| Plaid Cymru | Alun Llewellyn | 6,386 | 28.8 | −7.0 | |
| Liberal Democrats | Miss Helen C. Jones | 2,048 | 9.2 | −0.6 | |
| Conservative | Chris B. Smart | 2,011 | 9.1 | +2.0 | |
| Socialist Alliance | David Huw Pudner | 410 | 1.9 | +0.0 | |
| Majority | 4,946 | 22.3 | |||
| Turnout | 22,187 | 39.1 | −8.9 | ||
| Labour hold | Swing | +6.3 | |||
| Welsh Assembly Election 1999: Neath[2] | |||||
|---|---|---|---|---|---|
| Party | Candidate | Votes | % | ±% | |
| Labour | Gwenda Thomas | 12,234 | 45.5 | N/A | |
| Plaid Cymru | Trefor Jones | 9,616 | 35.8 | N/A | |
| Liberal Democrats | David R. Davies | 2,631 | 9.8 | N/A | |
| Conservative | Miss Jill F. Chambers | 1,895 | 7.1 | N/A | |
| Socialist Alliance | Nicholas Duncan | 519 | 1.9 | N/A | |
| Majority | 2,618 | 9.7 | N/A | ||
| Turnout | 26,895 | 48.0 | N/A | ||
| Labour win (new seat) | |||||
References
- ↑ Election results - 2007, National Assembly for Wales
- ↑ 2.0 2.1 Neath, Political Science Resources
| |||||||||||||||||
Coordinates: 51°43′14″N 3°46′11″W / 51.72056°N 3.76972°W