Mean reversion (finance)

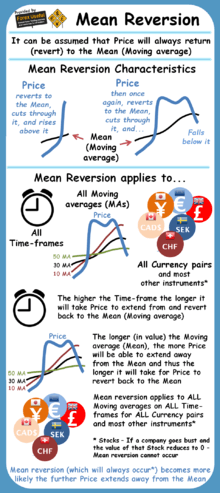
Mean reversion is a mathematical concept sometimes used for stock investing, but it can be applied to other assets. In general terms, the essence of the concept is the assumption that both a stock's high and low prices are temporary and that a stock's price will tend to move to the average price over time.[2]
Using mean reversion in stock price analysis involves both identifying the trading range for a stock and computing the average price using analytical techniques taking into account considerations such as earnings, etc.
When the current market price is less than the average price, the stock is considered attractive for purchase, with the expectation that the price will rise. When the current market price is above the average price, the market price is expected to fall. In other words, deviations from the average price are expected to revert to the average.
Stock reporting services commonly offer moving averages for periods such as 50 and 100 days. While reporting services provide the averages, identifying the high and low prices for the study period is still necessary.
Mean reversion has the appearance of a more scientific method of choosing stock buy and sell points than charting, because precise numerical values are derived from historical data to identify the buy/sell values, rather than trying to interpret price movements using charts (charting, also known as technical analysis).
Some asset classes, such as exchange rates, are observed to be mean reverting; however, this process may last for years and thus is not of value to an investor.
Mean reversion should demonstrate a form of symmetry since a stock may be above its historical average approximately as often as below.
A historical mean reversion model will not fully incorporate the actual behavior of a security's price. For example, new information may become available that permanently affects the long-term valuation of an underlying stock. In the case of bankruptcy, it may cease to trade completely and never recover to its former historical average.
See also
- Convergence trade
- Regression toward the mean
- Pairs trade
- Ornstein–Uhlenbeck process
- Trend following
- Gambler's fallacy
References
- ↑ "Mean Reversion Infographic". www.forexuseful.com. Retrieved 29 July 2013.
- ↑ Mean reversion