Harmonograph

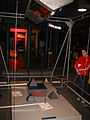
A harmonograph is a mechanical apparatus that employs pendulums to create a geometric image. The drawings created typically are Lissajous curves, or related drawings of greater complexity. The devices, which began to appear in the mid-19th century and peaked in popularity in the 1890s, cannot be conclusively attributed to a single person, although Hugh Blackburn, a professor of mathematics at the University of Glasgow, is commonly believed to be the official inventor.[1]
A simple, so-called "lateral" harmonograph uses two pendulums to control the movement of a pen relative to a drawing surface. One pendulum moves the pen back and forth along one axis and the other pendulum moves the drawing surface back and forth along a perpendicular axis. By varying the frequency and phase of the pendulums relative to one another, different patterns are created. Even a simple harmonograph as described can create ellipses, spirals, figure eights and other Lissajous figures.
More complex harmonographs incorporate three or more pendulums or linked pendulums together (for example hanging one pendulum off another), or involve rotary motion in which one or more pendulums is mounted on gimbals to allow movement in any direction.
A particular type of harmonograph, a pintograph, is based on the relative motion of two rotating disks, as illustrated in the links below.
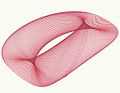
Computer-generated harmonograph figure
A harmonograph creates its figures using the movements of damped pendulums. The movement of a damped pendulum is described by the equation

in which  represents frequency,
  represent phase,
  represent amplitude,
  represents damping and
  represents time. If that pendulum can move about two axes (in a circular or elliptical shape), due to the principle of superposition, the motion of a rod connected to the bottom of the pendulum along one axes will be described by the equation

A typical harmonograph has two pendulums that move in such a fashion, and a pen that is moved by two perpendicular rods connected to these pendulums. Therefore the path of the harmonograph figure is described by the parametric equations


An appropriate computer program can translate those equations into a graph that emulates a harmonograph. Applying the first equation a second time to each equation can emulate a moving piece of paper (see the figure below).
Gallery
-

A figure produced by a simple lateral harmonograph.
-

A figure produced by a simple lateral harmonograph.
-
A figure produced by a pintograph.
-

Computer generated harmonograph figure.
See also
Notes
- ↑ Turner, Steven (February 1997). "Demonstrating Harmony: Some of the Many Devices Used To Produce Lissajous Curves Before the Oscilloscope". Rittenhouse 11 (42): 41.
External links
- A complex harmonograph with a unique single pendulum design
- Online interactive Harmonograph
- Harmonograph background, equations, and illustrations
- How to build a 3-pendulum rotary harmonograph
- HTML5 Animated Harmonograph
- Virtual Harmonograph web application
- An Animated Harmonogharph Model in MS Excel
- An interactive Pintograph for iOS