Electroglottographic wavegram
An electroglottographic wavegram (short: EGG wavegram) is a tool for analyzing the voice source in speech and singing, based on electroglottographic (EGG) signals (and their first derivative, DEGG).[1]
Assessing the singing and speaking voice

The wavegram provides an intuitive means for quickly assessing vocal fold contact phenomena and their variation over time. Vocal fold closings and openings appear here as a sequence of events rather than single incidents, taking place over a certain period of time, and changing with pitch, loudness and register. Wavegrams document systematic phenomena, indicating subtle changes of the vocal fold oscillatory regime.
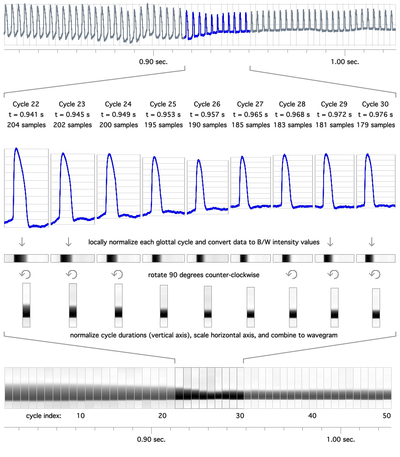
Electroglottographic wavegrams are created in 5 steps (see illustration):
- extraction of consecutive glottal cycles from the EGG signal;
- locally normalized data values are converted into monochrome color information, and are plotted as a strip representing one glottal cycle each;
- strips are rotated 90 degrees counter-clockwise;
- Glottal cycle duration is normalized by scaling the individual glottal cycle plots to the same height;
- the resulting graphs are combined to form the final display, the EGG wavegram.
Wavegram data can be influenced by
- the anatomical baseline of the individual;
- physiological and habitual muscular patterns in phonation, e.g. degree of vocal fold adduction, register in singing and speech;
- organic voice disorders, i.e. pathological deviations from the norm.
Wavegrams show a potential to be used in:
- screenings for voice disorders (e.g. in schools);
- (real-time) bio-feedback in voice pedagogy and education;[2]
- voice therapy (functional voice disorders);
- conservative and post-operative treatment of organic voice disorders;
- voice recognition in forensics.
To construct a wavegram, the time-varying fundamental frequency is calculated and consecutive individual glottal cycles are identified in the EGG or DEGG signal. Each cycle is locally normalized in duration and amplitude, the signal values are encoded by color intensity and the cycles are concatenated to display the entire phonation in a single image, much as in sound spectrography.
The idea of wavegrams can be extended to displaying other data, such as acoustic signals or high-speed video endoscopic recordings of the vibrating vocal folds.[3][4]
References
- ↑ Herbst, C. T., Fitch, W. T., and Svec, J. G. (2010). "Electroglottographic wavegrams: a technique for visualizing vocal fold dynamics noninvasively," J Acoust Soc Am 128, 3070-3078. - http://dx.doi.org/10.1121/1.3493423
- ↑ Herbst, C. T., Fitch, W. T., Schlömicher-Thier, J., and Svec, J. G. (2011). "Observing the female middle register using EGG wavegrams.", in 9th Pan-European Voice Conference (PEVOC) (Marseilles, France).
- ↑ Unger, J., Meyer, T., Herbst, C. T., Döllinger, M., and Lohscheller, J. (2011). "'PVG-Wavegrams: Three-dimensional visualization of vocal fold dynamics", in 7th International Workshop on Models and Analysis of Vocal Emissions for Biomedical Applications (MAVEBA) (Firenze, IT). - http://books.google.at/books?id=Xxgm2qtUTkQC&pg=PA31&lpg=PA31&dq=electroglottographic+wavegram&source=bl&ots=tgUCKNQPh0&sig=_Z37d0XqbAW7oK1nYrBbkdW0u9o&hl=de&ei=IPOaTrm2JMOOswbQw8WmBA&sa=X&oi=book_result&ct=result&resnum=1&ved=0CBoQ6AEwADgK#v=onepage&q=electroglottographic%20wavegram&f=false
- ↑ Unger, J., Meyer, T., Herbst, C. T., Döllinger, M., and Lohscheller, J. (2011). "PVG-Wavegramm: Dreidimensionale Visualisierung von Stimmlippendynamik", in 28. Wissenschaftliche Jahrestagung der Deutschen Gesellschaft für Phoniatrie und Pädaudiologie e. V. (Zurich, Switzerland). - http://www.egms.de/static/en/meetings/dgpp2011/11dgpp40.shtml
External links
- Proceedings of the 5th International Conference on the Physiology and Acoustics of Singing (PAS5), Stockholm, Sweden
- The Voice Foundation's 40th Annual Symposium: Care of the Professional Voice, 2011, Philadelphia, PA
- 7th International Workshop on Models and Analysis of Vocal Emissions for Biomedical Applications (MAVEBA), August 2011, Firenze, Italy