Edgbaston (ward)
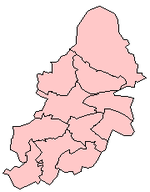
Edgbaston ward is a local government district, one of 40 wards that make up Birmingham City Council. Edgbaston lies to the south west of Birmingham city centre and is home to the University of Birmingham and the Queen Elizabeth hospital.
Ward Description
The ward covers an area of west Birmingham, including the districts of Edgbaston and parts of Ladywood. It also covers areas around the University Hospital.
The ward was created in 1838, and has been a ward ever since.
The boundary changes of 1950, transferred an area east of the railway line and north of Church Rd and Priory Rd, was transferred to Market Hall ward. To compensate for the loss of electorate, the ward was extended westwards to take in areas of north Harborne.
The boundary changes of 1962 so a reverse of the 1950 changes. The areas south of Lea Bank and Belgrave Roads from the Market Hall ward. Once again to balance the electorate, the area north of the Hagley Road close to the city boundary at Bearwood, and the area of northern Harborne which had been acquired in 1950 were transferred to Harborne ward.
Politics
The Edgbaston ward is currently represented by three Conservative Councillors; James Hutchings (1991-), Deirdre Alden (1999-) and Fergus Robinson (2002-).
Election results
2010s
| 3 May 2012
Electorate | |||||
|---|---|---|---|---|---|
| Party | Candidate | Votes | % | ±% | |
| Conservative | D Alden | 2240 | 46.1% | - | |
| Labour | D Minnis | 1999 | 41.1% | ||
| Liberal Democrat | C Green | 196 | 4.0% | ||
| Green | B Van Marle | 279 | 5.7% | ||
| UKIP | D Bridges | 131 | 2.7% | ||
| Majority | 241 | 5.0% | |||
| Conservative hold | Swing | ||||
| 5 May 2011
Electorate 18246 | |||||
|---|---|---|---|---|---|
| Party | Candidate | Votes | % | ±% | |
| Conservative | J Hutchings | 2555 | 41.7% | ||
| Labour | D Minnis | 2534 | 41.4% | ||
| Liberal Democrat | C Green | 472 | 7.7% | ||
| Green | P Tinsley | 414 | 6.8% | ||
| UKIP | G Houston | 145 | 2.4% | ||
| Majority | 21 | 0.3% | |||
| Conservative hold | Swing | ||||
| 6 May 2010
Electorate | |||||
|---|---|---|---|---|---|
| Party | Candidate | Votes | % | ±% | |
| Conservative | FD Robinson | 3,832 | 40.4 | -18.4 | |
| Labour | N Constantinou | 3,036 | 32.0 | +9.9 | |
| Liberal Democrat | R Hunter | 2,053 | 21.7 | +12.6 | |
| Green | E Moss | 378 | 4.0% | ||
| BNP | E Wainwright | 181 | 1.9% | ||
| Majority | 796 | 8.4% | |||
| Conservative hold | Swing | ||||
2000s
| 1 May 2008
Electorate | |||||
|---|---|---|---|---|---|
| Party | Candidate | Votes | % | ±% | |
| Conservative | D Alden | 2429 | 58.8% | ||
| Labour | R Dungate | 912 | 22.1% | ||
| Liberal Democrat | S Ritchie | 372 | 9.0% | ||
| Majority | 1517 | 36.7% | |||
| Conservative hold | Swing | ||||
| 3 May 2007
Electorate | |||||
|---|---|---|---|---|---|
| Party | Candidate | Votes | % | ±% | |
| Conservative | J Hutchings | 2410 | 51.9% | ||
| Labour | M Clee | 1196 | 25.7% | ||
| Liberal Democrat | S Ritchie | 524 | 11.3% | ||
| Green | B Smith | 322 | 6.9% | ||
| BNP | T Shearer | 121 | 2.6% | ||
| UKIP | F Jones | 75 | 1.6% | ||
| Majority | 1214 | 26.1% | |||
| Conservative hold | Swing | ||||
| 4 May 2006
Electorate | |||||
|---|---|---|---|---|---|
| Party | Candidate | Votes | % | ±% | |
| Conservative | % | ||||
| Labour | % | ||||
| Liberal Democrat | % | ||||
| Independent | % | ||||
| Majority | % | ||||
| Labour gain from Liberal Democrat | Swing | ||||
| Conservative hold | Swing | ||||
| 5 May 2005
Electorate | |||||
|---|---|---|---|---|---|
| Party | Candidate | Votes | % | ±% | |
| Conservative | % | ||||
| Labour | % | ||||
| Liberal Democrat | % | ||||
| Independent | % | ||||
| Majority | % | ||||
| Labour gain from Liberal Democrat | Swing | ||||
| Conservative hold | Swing | ||||
| 6 May 2004
Electorate | |||||
|---|---|---|---|---|---|
| Party | Candidate | Votes | % | ±% | |
| Conservative | % | ||||
| Labour | % | ||||
| Liberal Democrat | % | ||||
| Independent | % | ||||
| Majority | % | ||||
| Labour gain from Liberal Democrat | Swing | ||||
| Conservative hold | Swing | ||||
| 1 May 2003
Electorate | |||||
|---|---|---|---|---|---|
| Party | Candidate | Votes | % | ±% | |
| Conservative | % | ||||
| Labour | % | ||||
| Liberal Democrat | % | ||||
| Independent | % | ||||
| Majority | % | ||||
| Labour gain from Liberal Democrat | Swing | ||||
| Conservative hold | Swing | ||||
| 2 May 2002
Electorate | |||||
|---|---|---|---|---|---|
| Party | Candidate | Votes | % | ±% | |
| Conservative | % | ||||
| Labour | % | ||||
| Liberal Democrat | % | ||||
| Independent | % | ||||
| Majority | % | ||||
| Labour gain from Liberal Democrat | Swing | ||||
| Conservative hold | Swing | ||||
| 7 June 2001
Electorate | |||||
|---|---|---|---|---|---|
| Party | Candidate | Votes | % | ±% | |
| Conservative | % | ||||
| Labour | % | ||||
| Liberal Democrat | % | ||||
| Independent | % | ||||
| Majority | % | ||||
| Labour gain from Liberal Democrat | Swing | ||||
| Conservative hold | Swing | ||||
| 4 May 2000
Electorate | |||||
|---|---|---|---|---|---|
| Party | Candidate | Votes | % | ±% | |
| Conservative | % | ||||
| Labour | % | ||||
| Liberal Democrat | % | ||||
| Independent | % | ||||
| Majority | % | ||||
| Labour gain from Liberal Democrat | Swing | ||||
| Conservative hold | Swing | ||||
1990s
| 6 May 1999
Electorate | |||||
|---|---|---|---|---|---|
| Party | Candidate | Votes | % | ±% | |
| Conservative | % | ||||
| Labour | % | ||||
| Liberal | % | ||||
| Independent | % | ||||
| Majority | % | ||||
| Labour gain from Liberal | Swing | ||||
| Conservative hold | Swing | ||||
| 7 May 1998
Electorate | |||||
|---|---|---|---|---|---|
| Party | Candidate | Votes | % | ±% | |
| Conservative | % | ||||
| Labour | % | ||||
| Liberal | % | ||||
| Independent | % | ||||
| Majority | % | ||||
| Labour gain from Liberal | Swing | ||||
| Conservative hold | Swing | ||||
| 1 May 1997
Electorate | |||||
|---|---|---|---|---|---|
| Party | Candidate | Votes | % | ±% | |
| Conservative | % | ||||
| Labour | % | ||||
| Liberal | % | ||||
| Independent | % | ||||
| Majority | % | ||||
| Labour gain from Liberal | Swing | ||||
| Conservative hold | Swing | ||||
| 2 May 1996
Electorate | |||||
|---|---|---|---|---|---|
| Party | Candidate | Votes | % | ±% | |
| Conservative | % | ||||
| Labour | % | ||||
| Liberal | % | ||||
| Independent | % | ||||
| Majority | % | ||||
| Labour gain from Liberal | Swing | ||||
| Conservative hold | Swing | ||||
| 4 May 1995
Electorate | |||||
|---|---|---|---|---|---|
| Party | Candidate | Votes | % | ±% | |
| Conservative | % | ||||
| Labour | % | ||||
| Liberal | % | ||||
| Independent | % | ||||
| Majority | % | ||||
| Labour gain from Liberal | Swing | ||||
| Conservative hold | Swing | ||||
| 5 May 1994
Electorate | |||||
|---|---|---|---|---|---|
| Party | Candidate | Votes | % | ±% | |
| Conservative | % | ||||
| Labour | % | ||||
| Liberal | % | ||||
| Independent | % | ||||
| Majority | % | ||||
| Labour gain from Liberal | Swing | ||||
| Conservative hold | Swing | ||||
| 6 May 1993
Electorate | |||||
|---|---|---|---|---|---|
| Party | Candidate | Votes | % | ±% | |
| Conservative | % | ||||
| Labour | % | ||||
| Liberal | % | ||||
| Independent | % | ||||
| Majority | % | ||||
| Labour gain from Liberal | Swing | ||||
| Conservative hold | Swing | ||||
| 7 May 1992
Electorate | |||||
|---|---|---|---|---|---|
| Party | Candidate | Votes | % | ±% | |
| Conservative | % | ||||
| Labour | % | ||||
| Liberal | % | ||||
| Independent | % | ||||
| Majority | % | ||||
| Labour gain from Liberal | Swing | ||||
| Conservative hold | Swing | ||||
| 2 May 1991
Electorate | |||||
|---|---|---|---|---|---|
| Party | Candidate | Votes | % | ±% | |
| Conservative | % | ||||
| Labour | % | ||||
| Liberal | % | ||||
| Independent | % | ||||
| Majority | % | ||||
| Labour gain from Liberal | Swing | ||||
| Conservative hold | Swing | ||||
| 3 May 1990
Electorate | |||||
|---|---|---|---|---|---|
| Party | Candidate | Votes | % | ±% | |
| Conservative | % | ||||
| Labour | % | ||||
| Liberal | % | ||||
| Independent | % | ||||
| Majority | % | ||||
| Labour gain from Liberal | Swing | ||||
| Conservative hold | Swing | ||||
1980s
| 4 May 1989
Electorate | |||||
|---|---|---|---|---|---|
| Party | Candidate | Votes | % | ±% | |
| Conservative | % | ||||
| Labour | % | ||||
| Liberal | % | ||||
| Independent | % | ||||
| Majority | % | ||||
| Labour gain from Liberal | Swing | ||||
| Conservative hold | Swing | ||||
| 5 May 1988
Electorate | |||||
|---|---|---|---|---|---|
| Party | Candidate | Votes | % | ±% | |
| Conservative | % | ||||
| Labour | % | ||||
| Liberal | % | ||||
| Independent | % | ||||
| Majority | % | ||||
| Labour gain from Liberal | Swing | ||||
| Conservative hold | Swing | ||||
| 7 May 1987
Electorate | |||||
|---|---|---|---|---|---|
| Party | Candidate | Votes | % | ±% | |
| Conservative | % | ||||
| Labour | % | ||||
| Liberal | % | ||||
| Independent | % | ||||
| Majority | % | ||||
| Labour gain from Liberal | Swing | ||||
| Conservative hold | Swing | ||||
| 1 May 1986
Electorate | |||||
|---|---|---|---|---|---|
| Party | Candidate | Votes | % | ±% | |
| Conservative | % | ||||
| Labour | % | ||||
| Liberal | % | ||||
| Independent | % | ||||
| Majority | % | ||||
| Labour gain from Liberal | Swing | ||||
| Conservative hold | Swing | ||||
| 2 May 1985
Electorate | |||||
|---|---|---|---|---|---|
| Party | Candidate | Votes | % | ±% | |
| Conservative | % | ||||
| Labour | % | ||||
| Liberal | % | ||||
| Independent | % | ||||
| Majority | % | ||||
| Labour gain from Liberal | Swing | ||||
| Conservative hold | Swing | ||||
| 3 May 1984
Electorate | |||||
|---|---|---|---|---|---|
| Party | Candidate | Votes | % | ±% | |
| Conservative | % | ||||
| Labour | % | ||||
| Liberal | % | ||||
| Independent | % | ||||
| Majority | % | ||||
| Labour gain from Liberal | Swing | ||||
| Conservative hold | Swing | ||||
| 5 May 1983
Electorate | |||||
|---|---|---|---|---|---|
| Party | Candidate | Votes | % | ±% | |
| Conservative | % | ||||
| Labour | % | ||||
| Liberal | % | ||||
| Independent | % | ||||
| Majority | % | ||||
| Labour gain from Liberal | Swing | ||||
| Conservative hold | Swing | ||||
| 6 May 1982
Electorate | |||||
|---|---|---|---|---|---|
| Party | Candidate | Votes | % | ±% | |
| Conservative | % | ||||
| Labour | % | ||||
| Liberal | % | ||||
| Independent | % | ||||
| Majority | % | ||||
| Labour gain from Liberal | Swing | ||||
| Conservative hold | Swing | ||||
| 7 May 1981
Electorate | |||||
|---|---|---|---|---|---|
| Party | Candidate | Votes | % | ±% | |
| Conservative | % | ||||
| Labour | % | ||||
| Liberal | % | ||||
| Independent | % | ||||
| Majority | % | ||||
| Labour gain from Liberal | Swing | ||||
| Conservative hold | Swing | ||||
| 1 May 1980
Electorate | |||||
|---|---|---|---|---|---|
| Party | Candidate | Votes | % | ±% | |
| Conservative | % | ||||
| Labour | % | ||||
| Liberal | % | ||||
| Independent | % | ||||
| Majority | % | ||||
| Labour gain from Liberal | Swing | ||||
| Conservative hold | Swing | ||||
1970s
| 3 May 1979
Electorate | |||||
|---|---|---|---|---|---|
| Party | Candidate | Votes | % | ±% | |
| Conservative | % | ||||
| Labour | % | ||||
| Liberal | % | ||||
| Independent | % | ||||
| Majority | % | ||||
| Labour gain from Liberal | Swing | ||||
| Conservative hold | Swing | ||||
| 4 May 1978
Electorate | |||||
|---|---|---|---|---|---|
| Party | Candidate | Votes | % | ±% | |
| Conservative | % | ||||
| Labour | % | ||||
| Liberal | % | ||||
| Independent | % | ||||
| Majority | % | ||||
| Labour gain from Liberal | Swing | ||||
| Conservative hold | Swing | ||||
| 5 May 1977
Electorate | |||||
|---|---|---|---|---|---|
| Party | Candidate | Votes | % | ±% | |
| Conservative | % | ||||
| Labour | % | ||||
| Liberal | % | ||||
| Independent | % | ||||
| Majority | % | ||||
| Labour gain from Liberal | Swing | ||||
| Conservative hold | Swing | ||||
| 6 May 1976
Electorate | |||||
|---|---|---|---|---|---|
| Party | Candidate | Votes | % | ±% | |
| Conservative | % | ||||
| Labour | % | ||||
| Liberal | % | ||||
| Independent | % | ||||
| Majority | % | ||||
| Labour gain from Liberal | Swing | ||||
| Conservative hold | Swing | ||||
| 1 May 1975
Electorate | |||||
|---|---|---|---|---|---|
| Party | Candidate | Votes | % | ±% | |
| Conservative | % | ||||
| Labour | % | ||||
| Liberal | % | ||||
| Independent | % | ||||
| Majority | % | ||||
| Labour gain from Liberal | Swing | ||||
| Conservative hold | Swing | ||||
| 2 May 1974
Electorate | |||||
|---|---|---|---|---|---|
| Party | Candidate | Votes | % | ±% | |
| Conservative | % | ||||
| Labour | % | ||||
| Liberal | % | ||||
| Independent | % | ||||
| Majority | % | ||||
| Labour gain from Liberal | Swing | ||||
| Conservative hold | Swing | ||||
| 3 May 1973
Electorate | |||||
|---|---|---|---|---|---|
| Party | Candidate | Votes | % | ±% | |
| Conservative | % | ||||
| Labour | % | ||||
| Liberal | % | ||||
| Independent | % | ||||
| Majority | % | ||||
| Labour gain from Liberal | Swing | ||||
| Conservative hold | Swing | ||||
| 4 May 1972
Electorate | |||||
|---|---|---|---|---|---|
| Party | Candidate | Votes | % | ±% | |
| Conservative | % | ||||
| Labour | % | ||||
| Liberal | % | ||||
| Independent | % | ||||
| Majority | % | ||||
| Labour gain from Liberal | Swing | ||||
| Conservative hold | Swing | ||||
| 13 May 1971
Electorate | |||||
|---|---|---|---|---|---|
| Party | Candidate | Votes | % | ±% | |
| Conservative | % | ||||
| Labour | % | ||||
| Liberal | % | ||||
| Independent | % | ||||
| Majority | % | ||||
| Labour gain from Liberal | Swing | ||||
| Conservative hold | Swing | ||||
| 7 May 1970
Electorate | |||||
|---|---|---|---|---|---|
| Party | Candidate | Votes | % | ±% | |
| Conservative | % | ||||
| Labour | % | ||||
| Liberal | % | ||||
| Independent | % | ||||
| Majority | % | ||||
| Labour gain from Liberal | Swing | ||||
| Conservative hold | Swing | ||||
1960s
| 8 May 1969
Electorate | |||||
|---|---|---|---|---|---|
| Party | Candidate | Votes | % | ±% | |
| Conservative | % | ||||
| Labour | % | ||||
| Liberal | % | ||||
| Independent | % | ||||
| Majority | % | ||||
| Labour gain from Liberal | Swing | ||||
| Conservative hold | Swing | ||||
| 9 May 1968
Electorate | |||||
|---|---|---|---|---|---|
| Party | Candidate | Votes | % | ±% | |
| Conservative | % | ||||
| Labour | % | ||||
| Liberal | % | ||||
| Independent | % | ||||
| Majority | % | ||||
| Labour gain from Liberal | Swing | ||||
| Conservative hold | Swing | ||||
| 11 May 1967
Electorate | |||||
|---|---|---|---|---|---|
| Party | Candidate | Votes | % | ±% | |
| Conservative | % | ||||
| Labour | % | ||||
| Liberal | % | ||||
| Independent | % | ||||
| Majority | % | ||||
| Labour gain from Liberal | Swing | ||||
| Conservative hold | Swing | ||||
| 12 May 1966
Electorate | |||||
|---|---|---|---|---|---|
| Party | Candidate | Votes | % | ±% | |
| Conservative | % | ||||
| Labour | % | ||||
| Liberal | % | ||||
| Independent | % | ||||
| Majority | % | ||||
| Labour gain from Liberal | Swing | ||||
| Conservative hold | Swing | ||||
| 13 May 1965
Electorate | |||||
|---|---|---|---|---|---|
| Party | Candidate | Votes | % | ±% | |
| Conservative | % | ||||
| Labour | % | ||||
| Liberal | % | ||||
| Independent | % | ||||
| Majority | % | ||||
| Labour gain from Liberal | Swing | ||||
| Conservative hold | Swing | ||||
| 7 May 1964
Electorate | |||||
|---|---|---|---|---|---|
| Party | Candidate | Votes | % | ±% | |
| Conservative | % | ||||
| Labour | % | ||||
| Liberal | % | ||||
| Independent | % | ||||
| Majority | % | ||||
| Labour gain from Liberal | Swing | ||||
| Conservative hold | Swing | ||||
| 9 May 1963
Electorate | |||||
|---|---|---|---|---|---|
| Party | Candidate | Votes | % | ±% | |
| Conservative | % | ||||
| Labour | % | ||||
| Liberal | % | ||||
| Independent | % | ||||
| Majority | % | ||||
| Labour gain from Liberal | Swing | ||||
| Conservative hold | Swing | ||||
| 10 May 1962
Electorate | |||||
|---|---|---|---|---|---|
| Party | Candidate | Votes | % | ±% | |
| Conservative | % | ||||
| Labour | % | ||||
| Liberal | % | ||||
| Independent | % | ||||
| Majority | % | ||||
| Labour gain from Liberal | Swing | ||||
| Conservative hold | Swing | ||||
| 11 May 1961
Electorate | |||||
|---|---|---|---|---|---|
| Party | Candidate | Votes | % | ±% | |
| Conservative | % | ||||
| Labour | % | ||||
| Liberal | % | ||||
| Independent | % | ||||
| Majority | % | ||||
| Labour gain from Liberal | Swing | ||||
| Conservative hold | Swing | ||||
| 12 May 1960
Electorate | |||||
|---|---|---|---|---|---|
| Party | Candidate | Votes | % | ±% | |
| Conservative | % | ||||
| Labour | % | ||||
| Liberal | % | ||||
| Independent | % | ||||
| Majority | % | ||||
| Labour gain from Liberal | Swing | ||||
| Conservative hold | Swing | ||||
1950s
| 14 May 1959
Electorate | |||||
|---|---|---|---|---|---|
| Party | Candidate | Votes | % | ±% | |
| Conservative | % | ||||
| Labour | % | ||||
| Liberal | % | ||||
| Independent | % | ||||
| Majority | % | ||||
| Labour gain from Liberal | Swing | ||||
| Conservative hold | Swing | ||||
| 8 May 1958
Electorate | |||||
|---|---|---|---|---|---|
| Party | Candidate | Votes | % | ±% | |
| Conservative | % | ||||
| Labour | % | ||||
| Liberal | % | ||||
| Independent | % | ||||
| Majority | % | ||||
| Labour gain from Liberal | Swing | ||||
| Conservative hold | Swing | ||||
| 9 May 1957
Electorate | |||||
|---|---|---|---|---|---|
| Party | Candidate | Votes | % | ±% | |
| Conservative | % | ||||
| Labour | % | ||||
| Liberal | % | ||||
| Independent | % | ||||
| Majority | % | ||||
| Labour gain from Liberal | Swing | ||||
| Conservative hold | Swing | ||||
| 10 May 1956
Electorate | |||||
|---|---|---|---|---|---|
| Party | Candidate | Votes | % | ±% | |
| Conservative | % | ||||
| Labour | % | ||||
| Liberal | % | ||||
| Independent | % | ||||
| Majority | % | ||||
| Labour gain from Liberal | Swing | ||||
| Conservative hold | Swing | ||||
| 12 May 1955
Electorate | |||||
|---|---|---|---|---|---|
| Party | Candidate | Votes | % | ±% | |
| Conservative | % | ||||
| Labour | % | ||||
| Liberal | % | ||||
| Independent | % | ||||
| Majority | % | ||||
| Labour gain from Liberal | Swing | ||||
| Conservative hold | Swing | ||||
| 13 May 1954
Electorate | |||||
|---|---|---|---|---|---|
| Party | Candidate | Votes | % | ±% | |
| Conservative | % | ||||
| Labour | % | ||||
| Liberal | % | ||||
| Independent | % | ||||
| Majority | % | ||||
| Labour gain from Liberal | Swing | ||||
| Conservative hold | Swing | ||||
| 7 May 1953
Electorate | |||||
|---|---|---|---|---|---|
| Party | Candidate | Votes | % | ±% | |
| Conservative | % | ||||
| Labour | % | ||||
| Liberal | % | ||||
| Independent | % | ||||
| Majority | % | ||||
| Labour gain from Liberal | Swing | ||||
| Conservative hold | Swing | ||||
| 8 May 1952
Electorate | |||||
|---|---|---|---|---|---|
| Party | Candidate | Votes | % | ±% | |
| Conservative | % | ||||
| Labour | % | ||||
| Liberal | % | ||||
| Independent | % | ||||
| Majority | % | ||||
| Labour gain from Liberal | Swing | ||||
| Conservative hold | Swing | ||||
| 10 May 1951
Electorate | |||||
|---|---|---|---|---|---|
| Party | Candidate | Votes | % | ±% | |
| Conservative | % | ||||
| Labour | % | ||||
| Liberal | % | ||||
| Independent | % | ||||
| Majority | % | ||||
| Labour gain from Liberal | Swing | ||||
| Conservative hold | Swing | ||||
| 11 May 1950
Electorate | |||||
|---|---|---|---|---|---|
| Party | Candidate | Votes | % | ±% | |
| Conservative | % | ||||
| Labour | % | ||||
| Liberal | % | ||||
| Independent | % | ||||
| Majority | % | ||||
| Labour gain from Liberal | Swing | ||||
| Conservative hold | Swing | ||||
1940s
| 12 May 1949
Electorate | |||||
|---|---|---|---|---|---|
| Party | Candidate | Votes | % | ±% | |
| Conservative | % | ||||
| Labour | % | ||||
| Liberal | % | ||||
| Independent | % | ||||
| Majority | % | ||||
| Labour gain from Liberal | Swing | ||||
| Conservative hold | Swing | ||||
| 1 November 1947
Electorate | |||||
|---|---|---|---|---|---|
| Party | Candidate | Votes | % | ±% | |
| Conservative | % | ||||
| Labour | % | ||||
| Liberal | % | ||||
| Independent | % | ||||
| Majority | % | ||||
| Labour gain from Liberal | Swing | ||||
| Conservative hold | Swing | ||||
| 2 November 1946
Electorate | |||||
|---|---|---|---|---|---|
| Party | Candidate | Votes | % | ±% | |
| Conservative | % | ||||
| Labour | % | ||||
| Liberal | % | ||||
| Independent | % | ||||
| Majority | % | ||||
| Labour gain from Liberal | Swing | ||||
| Conservative hold | Swing | ||||
| 3 November 1945
Electorate | |||||
|---|---|---|---|---|---|
| Party | Candidate | Votes | % | ±% | |
| Conservative | % | ||||
| Labour | % | ||||
| Liberal | % | ||||
| Independent | % | ||||
| Majority | % | ||||
| Labour gain from Liberal | Swing | ||||
| Conservative hold | Swing | ||||
| ||||||||||||||||||||||||||||||||||||||