Bifurcation diagram
In mathematics, particularly in dynamical systems, a bifurcation diagram shows the possible long-term values (equilibria/fixed points or periodic orbits) of a system as a function of a bifurcation parameter in the system. It is usual to represent stable solutions with a solid line and unstable solutions with a dotted line.
Bifurcations in 1D discrete dynamical systems
Logistic map


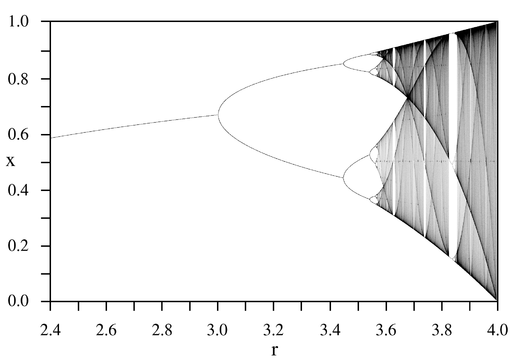
An example is the bifurcation diagram of the logistic map:
The bifurcation parameter r is shown on the horizontal axis of the plot and the vertical axis shows the possible long-term population values of the logistic function.
The bifurcation diagram nicely shows the forking of the possible periods of stable orbits from 1 to 2 to 4 to 8 etc. Each of these bifurcation points is a period-doubling bifurcation. The ratio of the lengths of successive intervals between values of r for which bifurcation occurs converges to the first Feigenbaum constant.
Real quadratic map
The map is  .
.
Symmetry breaking in bifurcation sets

In a dynamical system such as
 ,
,
which is structurally stable when  , if a bifurcation diagram is plotted, treating
  as the bifurcation parameter, but for different values of
  , the case
  is the symmetric pitchfork bifurcation. When
  , we say we have a pitchfork with broken symmetry. This is illustrated in the animation on the right.
See also
- Bifurcation theory
- Feigenbaum constants
- Phase portrait
- Skeleton of bifurcation diagram
References
- Paul Glendinning, "Stability, Instability and Chaos", Cambridge University Press, 1994.
- Steven Strogatz, "Non-linear Dynamics and Chaos: With applications to Physics, Biology, Chemistry and Engineering", Perseus Books, 2000.
External links
- Logistic Map Simulation. A Java applet simulating the Logistic Map by Yuval Baror.
- The Logistic Map and Chaos
