Standard score
In statistics, a standard score indicates how many standard deviations an observation or datum is above or below the mean. It is a dimensionless quantity derived by subtracting the population mean from an individual raw score and then dividing the difference by the population standard deviation. This conversion process is called standardizing or normalizing; however, "normalizing" can refer to many types of ratios; see normalization (statistics) for more.
Standard scores are also called z-values, z-scores, normal scores, and standardized variables; the use of "Z" is because the normal distribution is also known as the "Z distribution". They are most frequently used to compare a sample to a standard normal deviate (standard normal distribution, with μ = 0 and σ = 1), though they can be defined without assumptions of normality.
The z-score is only defined if one knows the population parameters, as in standardized testing; if one only has a sample set, then the analogous computation with sample mean and sample standard deviation yields the Student's t-statistic.
The standard score is not the same as the z-factor used in the analysis of high-throughput screening data though the two are often conflated.
Contents |
Calculation from raw score
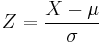
The standard score is

where:
- x is a raw score to be standardized;
- μ is the mean of the population;
- σ is the standard deviation of the population.
The quantity z represents the distance between the raw score and the population mean in units of the standard deviation. z is negative when the raw score is below the mean, positive when above.
A key point is that calculating z requires the population mean and the population standard deviation, not the sample mean or sample deviation. It requires knowing the population parameters, not the statistics of a sample drawn from the population of interest. But knowing the true standard deviation of a population is often unrealistic except in cases such as standardized testing, where the entire population is measured. In cases where it is impossible to measure every member of a population, the standard deviation may be estimated using a random sample. For example, a population of people who smoke cigarettes is not fully measured.
Applications
The z-score is most often used in the z-test in standardized testing – the analog of the Student's t-test for a population whose parameters are known, rather than estimated. As it is very unusual to know the entire population, the t-test is much more widely used.
Percentile ranks and prediction intervals
With a population that is normally distributed with known mean and known variance, the percentile rank and prediction interval may be determined from the standard score.
With known mean and known variance, prediction intervals can be calculated by subtracting from or adding to the mean (µ) with the standard deviation (σ) multiplied by a standard score (z) that is specific for what prediction intervals are desired:
| Prediction interval |
Standard score (z) |
|---|---|
| 50% | 0.67[1] |
| 68% | 1.00[1] |
| 90% | 1.64[1] |
| 95% | 1.96[1] |
| 99% | 2.58[1] |
- Lower limit of prediction interval = µ - σz
- Upper limit of prediction interval = µ + σz
About 68.27% of the values lie within 1 standard deviation of the mean. Similarly, about 95.45% of the values lie within 2 standard deviations of the mean. Nearly all (99.73%) of the values lie within 3 standard deviations of the mean. This is known as the 68-95-99.7 rule.
For example, to calculate the 95% prediction interval for a normal distribution with a mean (µ) of 5 and a standard deviation (σ) of 1, then the lower limit of the prediction interval is approximately 5 ‒ (1*2) = 3, and the upper limit is approximately 7, thus giving a prediction interval of approximately 3 to 7.
Contributions to trend
Z-scores can be used as a way of understanding the contributions from various subsets of data to an overall test of trend, such as trends in the rate of occurrence of cancer and the subsets considered approximately 55 different types of cancer, together with various groupings of these types. In this instance, the use of z-scores is not immediately as a test statistic for a significance test, but rather as a numerical guide to finding subsets of data which might show different trends than others.[2]
Standardizing in mathematical statistics
In mathematical statistics, a random variable X is standardized using the theoretical (population) mean and standard deviation:
where ![\mu = \operatorname{E}[X]](/2012-wikipedia_en_all_nopic_01_2012/I/93a1a008dfc61751307c7988794e4f5f.png) is the mean and
is the mean and 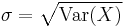 the standard deviation of the probability distribution of X.
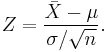
If the random variable under consideration is the sample mean:
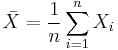
then the standardized version is
See normalization (statistics) for other forms of normalization.
A common name for standard score is the z-score. It is often used in statistics.
See also
References
- ^ a b c d e Page 111 in: Kirkup, Les (2002). Data analysis with Excel: an introduction for physical scientists. Cambridge, UK: Cambridge University Press. ISBN 0-521-79737-3.
- ^ Darby, S.C., Reissland, J.A. (1981) "Low levels of ionizing radiation and cancer — are we underestimating the risk? (with discussion)". Journal of the Royal Statistical Society, Series A, 144(3), 298–331.
Further reading
- Carroll, Susan Rovezzi; Carroll, David J. (2002). Statistics Made Simple for School Leaders (illustrated ed.). Rowman & Littlefield. ISBN 9780810843226. http://books.google.com/?id=gccHkMDikb0C. Retrieved 7 June 2009
- Richard J. Larsen and Morris L. Marx (2000) An Introduction to Mathematical Statistics and Its Applications, Third Edition, ISBN 0139223037. p. 282.
|
|||||||||||||||||||||||||||||||||||||||||||||||||||||||||||||||||||||||||||||||||||||||||||||||||||||||||||||||||||||||||||||||||||||||||||