Titration
Titration, also known as titrimetry,[1] is a common laboratory method of quantitative chemical analysis that is used to determine the unknown concentration of an identified analyte. Because volume measurements play a key role in titration, it is also known as volumetric analysis. A reagent, called the titrant or titrator[2] is prepared as a standard solution. A known concentration and volume of titrant reacts with a solution of analyte or titrand[3] to determine concentration.
Contents |
History and etymology
The word "titration" comes from the Latin word titulus, meaning inscription or title. The French word titre, also from this origin, means rank. Titration, by definition, is the determination of rank or concentration of a solution with respect to water with a pH of 7 (the pH of pure H2O under standard conditions).[4]
Volumetric analysis originated in late 18th-century France. Francois Antoine Henri Descroizilles developed the first burette (which was similar to a graduated cylinder) in 1791.[5] Joseph Louis Gay-Lussac developed an improved version of the burette that included a side arm, and coined the terms "pipette" and "burette" in an 1824 paper on the standardization of indigo solutions. A major breakthrough in the methodology and popularization of volumetric analysis was due to Karl Friedrich Mohr, who redesigned the burette by placing a clamp and a tip at the bottom, and wrote the first textbook on the topic, Lehrbuch der chemisch-analytischen Titrirmethode (Textbook of analytical-chemical titration methods), published in 1855.[6]
Procedure
A typical titration begins with a beaker or Erlenmeyer flask containing a precise volume of the titrand and a small amount of indicator placed underneath a calibrated burette or chemistry pipetting syringe containing the titrant. Small volumes of the titrant are then added to the titrand and indicator until the indicator changes, reflecting arrival at the endpoint of the titration. Depending on the endpoint desired, single drops or less than a single drop of the titrant can make the difference between a permanent and temporary change in the indicator. When the endpoint of the reaction is reached, the volume of reactant consumed is measured and used to calculate the concentration of analyte by
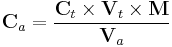
where Ca is the concentration of the analyte, typically in molarity; Ct is the concentration of the titrant, typically in molarity; Vt is the volume of the titrant used, typically in dm3; M is the mole ratio of the analyte and reactant from the balanced chemical equation; and Va is the volume of the analyte used, typically in dm3.[7]
Preparation techniques
Typical titrations require titrant and analyte to be in a liquid (solution) form. Though solids are usually dissolved into an aqueous solution, other solvents such as glacial acetic acid or ethanol are used for special purposes (as in petrochemistry).[8] Concentrated analytes are often diluted to improve accuracy.
Many non-acid-base titrations require a constant pH throughout the reaction. Therefore a buffer solution may be added to the titration chamber to maintain the pH.[9]
In instances where two reactants in a sample may react with the titrant and only one is the desired analyte, a separate masking solution may be added to the reaction chamber which masks the unwanted ion.[10]
Some redox reactions may require heating the sample solution and titrating while the solution is still hot to increase the reaction rate. For instance, the oxidation of some oxalate solutions requires heating to 60 °C (140 °F) to maintain a reasonable rate of reaction.[11]
Titration curves
A titration curve is a curve in the plane whose x-coordinate is the volume of titrant added since the beginning of the titration, and whose y-coordinate is the concentration of the analyte at the corresponding stage of the titration (in an acid-base titration, the y-coordinate is usually the pH of the solution).[12]
In an acid-base titration, the titration curve reflects the strength of the corresponding acid and base. For a strong acid and a strong base, the curve will be relatively smooth and very steep near the equivalence point. Because of this, a small change in titrant volume near the equivalence point results in a large pH change and many indicators would be appropriate (for instance litmus, phenolphthalein or bromothymol blue).
If one reagent is a weak acid or base and the other is a strong acid or base, the titration curve is irregular and the pH shifts less with small additions of titrant near the equivalence point. For example, the titration curve for the titration between oxalic acid (a weak acid) and sodium hydroxide (a strong base) is pictured. The equivalence point occurs between pH 8-10, indicating the solution is basic at the equivalence point and an indicator such as phenolphthalein would be appropriate. Titration curves corresponding to weak bases and strong acids are similarly behaved, with the solution being acidic at the equivalence point and indicators such as methyl orange and bromothymol blue being most appropriate.
Titrations between a weak acid and a weak base have titration curves which are highly irregular. Because of this, no definite indicator may be appropriate and a pH meter is often used to monitor the reaction.[13]
The type of function that can be used to describe the curve is called a sigmoid function.
Types of titrations
There are many types of titrations with different procedures and goals. The most common types of qualitative titration are acid-base titrations and redox titrations.
Acid-base titration
| Indicator | Color on acidic side | Range of color change | Color on basic side |
|---|---|---|---|
| Methyl Violet | Yellow | 0.0–1.6 | Violet |
| Bromophenol Blue | Yellow | 3.0–4.6 | Blue |
| Methyl Orange | Red | 3.1–4.4 | Yellow |
| Methyl Red | Red | 4.4–6.3 | Yellow |
| Litmus | Red | 5.0–8.0 | Blue |
| Bromothymol Blue | Yellow | 6.0–7.6 | Blue |
| Phenolphthalein | Colorless | 8.3–10.0 | Pink |
| Alizarin Yellow | Yellow | 10.1–12.0 | Red |
Acid-base titrations depend on the neutralization between an acid and a base when mixed in solution. In addition to the sample, an appropriate indicator is added to the titration chamber, reflecting the pH range of the equivalence point. The acid-base indicator indicates the endpoint of the titration by changing color. The endpoint and the equivalence point are not exactly the same because the equivalence point is determined by the stoichiometry of the reaction while the endpoint is just the color change from the indicator. Thus, a careful selection of the indicator will reduce the indicator error. For example, if the equivalence point is at a pH of 8.4, then the Phenolphthalein indicator would be used instead of Alizarin Yellow because phenolphthalein would reduce the indicator error. Common indicators, their colors, and the pH range in which they change color are given in the table above.[14] When more precise results are required, or when the reagents are a weak acid and a weak base, a pH meter or a conductance meter are used.
Redox titration
Redox titrations are based on a reduction-oxidation reaction between an oxidizing agent and a reducing agent. A potentiometer or a redox indicator is usually used to determine the endpoint of the titration, as when one of the constituents is the oxidizing agent potassium dichromate. The color change of the solution from orange to green is not definite, therefore an indicator such as sodium diphenylamine is used.[15] Analysis of wines for sulfur dioxide requires iodine as an oxidizing agent. In this case, starch is used as an indicator; a blue starch-iodine complex is formed in the presence of excess iodine, signalling the endpoint.[16]
Some redox titrations do not require an indicator, due to the intense color of the constituents. For instance, in permanganometry a slight faint persisting pink color signals the endpoint of the titration because of the color of the excess oxidizing agent potassium permanganate.[17]
Gas phase titration
Gas phase titrations are titrations done in the gas phase, specifically as methods for determining reactive species by reaction with an excess of some other gas, acting as the titrant. Most commonly the gaseous analyte is ozone, which is titrated with nitrogen oxide according to the reaction
After the reaction is complete, the remaining titrant and product are quantified (e.g., by FT-IR); this is used to determine the amount of analyte in the original sample.
Gas phase titration has several advantages over simple spectrophotometry. First, the measurement does not depend on path length, because the same path length is used for the measurement of both the excess titrant and the product. Second, the measurement does not depend on a linear change in absorbance as a function of analyte concentration as defined by the Beer-Lambert law. Third, it is useful for samples containing species which interfere at wavelengths typically used for the analyte.[20]
Complexometric titration
Complexometric titrations rely on the formation of a complex between the analyte and the titrant. In general, they require specialized indicators that form weak complexes with the analyte. Common examples are Eriochrome Black T for the titration of calcium and magnesium ions, and the chelating agent EDTA used to titrate metal ions in solution.[21]
Zeta potential titration
Zeta potential titrations are titrations in which the completion is monitored by the zeta potential, rather than by an indicator, in order to characterize heterogeneous systems, such as colloids.[22] One of the uses is to determine the iso-electric point when surface charge becomes zero, achieved by changing the pH or adding surfactant. Another use is to determine the optimum dose for flocculation or stabilization.[23]
Assay
An assay is a form of biological titration used to determine the concentration of a virus or bacterium. Serial dilutions are performed on a sample in a fixed ratio (such as 1:1, 1:2, 1:4, 1:8, etc.) until the last dilution does not give a positive test for the presence of the virus. This value is known as the titer, and is most commonly determined through enzyme-linked immunosorbent assay (ELISA).[24]
Measuring the endpoint of a titration
Different methods to determine the endpoint include[25]:
- Indicator: A substance that changes color in response to a chemical change. An acid-base indicator (e.g., phenolphthalein) changes color depending on the pH. Redox indicators are also used. A drop of indicator solution is added to the titration at the beginning; the endpoint has been reached when the color changes.
- Potentiometer: An instrument that measures the electrode potential of the solution. These are used for redox titrations; the potential of the working electrode will suddenly change as the endpoint is reached.
- pH meter: A potentiometer with an electrode whose potential depends on the amount of H+ ion present in the solution. (This is an example of an ion-selective electrode.) The pH of the solution is measured throughout the titration, more accurately than with an indicator; at the endpoint there will be a sudden change in the measured pH.
- Conductivity: A measurement of ions in a solution. Ion concentration can change significantly in a titration, which changes the conductivity. (For instance, during an acid-base titration, the H+ and OH- ions react to form neutral H2O.) As total conductance depends on all ions present in the solution and not all ions contribute equally (due to mobility and ionic strength), predicting the change in conductivity is more difficult than measuring it.
- Color change: In some reactions, the solution changes color without any added indicator. This is often seen in redox titrations when the different oxidation states of the product and reactant produce different colors.
- Precipitation: If a reaction produces a solid, a precipitate will form during the titration. A classic example is the reaction between Ag+ and Cl- to form the insoluble salt AgCl. Cloudy precipitates usually make it difficult to determine the endpoint precisely. To compensate, precipitation titrations often have to be done as "back" titrations (see below).
- Isothermal titration calorimeter: An instrument that measures the heat produced or consumed by the reaction to determine the endpoint. Used in biochemical titrations, such as the determination of how substrates bind to enzymes.
- Thermometric titrimetry: Differentiated from calorimetric titrimetry because the heat of the reaction (as indicated by temperature rise or fall) is not used to determine the amount of analyte in the sample solution. Instead, the endpoint is determined by the rate of temperature change.
- Spectroscopy: Used to measure the absorption of light by the solution during titration if the spectrum of the reactant, titrant or product is known. The concentration of the material can be determined by Beer's Law.
- Aperometry: Measures the current produced by the titration reaction as a result of the oxidation or reduction of the analyte. The endpoint is detected as a change in the current. This method is most useful when the excess titrant can be reduced, as in the titration of halides with Ag+.
Endpoint and equivalence point
Though equivalence point and endpoint are used interchangeably, they are different terms. Equivalence point is the theoretical completion of the reaction: the volume of added titrant at which the number of moles of titrant is equal to the number of moles of analyte, or some multiple thereof (as in polyprotic acids). Endpoint is what is actually measured, a physical change in the solution as determined by an indicator or an instrument mentioned above.[26]
There is a slight difference between the endpoint and the equivalence point of the titration. This error is referred to as an indicator error, and it is indeterminate.[27]
Back titration
Back titration is a titration done in reverse; instead of titrating the original sample, a known excess of standard reagent is added to the solution, and the excess is titrated. A back titration is useful if the endpoint of the reverse titration is easier to identify than the endpoint of the normal titration, as with precipitation reactions. Back titrations are also useful if the reaction between the analyte and the titrant is very slow, or when the analyte is in a non-soluble solid.[28]
Particular uses
Specific examples of titrations include:
- Acid-Base Titrations
- In biodiesel: Waste vegetable oil (WVO) must be neutralized before a batch may be processed. A portion of WVO is titrated with a base to determine acidity, so the rest of the batch may be properly neutralized. This removes free fatty acids from the WVO that would normally react to make soap instead of biodiesel.[29]
- Kjeldahl method: A measure of nitrogen content in a sample. Organic nitrogen is digested into ammonia with sulfuric acid and potassium sulfate. Finally, ammonia is back titrated with boric acid and then sodium carbonate.[30]
- Acid value: The mass in milligrams of potassium hydroxide (KOH) required to neutralize carboxylic acid in one gram of sample. An example is the determination of free fatty acid content. These titrations are achieved at low temperatures.
- Saponification value: The mass in milligrams of KOH required to saponify carboxylic acid in one gram of sample. Saponification is used to determine average chain length of fatty acids in fat. These titrations are achieved at high temperatures.
- Ester value (or ester index): A calculated index. Ester value = Saponification value – Acid value.
- Amine value: The mass in milligrams of KOH equal to the amine content in one gram of sample.
- Hydroxyl value: The mass in milligrams of KOH required to neutralize hydroxyl groups in one gram of sample. The analyte is acetylated using acetic anhydride then titrated with KOH.
- Redox titrations
- Winkler test for dissolved oxygen: Used to determine oxygen concentration in water. Oxygen in water samples is reduced using manganese(II) sulfate, which reacts with potassium iodide to produce iodine. The iodine is released in proportion to the oxygen in the sample, thus the oxygen concentration is determined with a redox titration of iodine with thiosulfate using a starch indicator.[31]
- Vitamin C: Also known as ascorbic acid, vitamin C is a powerful reducing agent. Its concentration can easily be identified when titrated with the blue dye Dichlorophenolindophenol (DCPIP) which turns colorless when reduced by the vitamin.[32]
- Benedict's reagent: Excess glucose in urine may indicate diabetes in the patient. Benedict's method is the conventional method to quantify glucose in urine using a prepared reagent. In this titration, glucose reduces cupric ions to cuprous ions which react with potassium thiocyanate to produce a white precipitate, indicating the endpoint.[33]
- Bromine number: A measure of unsaturation in an analyte, expressed in milligrams of bromine absorbed by 100 grams of sample.
- Iodine number: A measure of unsaturation in an analyte, expressed in grams of iodine absorbed by 100 grams of sample.
- Miscellaneous
- Karl Fischer titration: A potentiometric method to analyze trace amounts of water in a substance. A sample is dissolved in methanol, and titrated with Karl Fischer reagent. The reagent contains iodine, which reacts proportionally with water. Thus, the water content can be determined by monitoring the potential of excess iodine.[34]
See also
References
- ^ Whitney, W.D.; B.E. Smith (1911). "titrimetry.". The Century Dictionary and Cyclopedia. The Century co.. pp. 6504.
- ^ Compendium for Basal Practice in Biochemistry. Aarhus University. 2008.
- ^ "titrand". Science & Technology Dictionary. McGraw-Hill. http://www.answers.com/topic/titrand. Retrieved 30 September 2011.
- ^ The World Book dictionary. 2. Chicago, IL: World Book Inc.. 2007. pp. 2198. ISBN 0-7166-0299-7.
- ^ Szabadváry, F. (1993). History of Analytical Chemistry. Taylor & Francis. pp. 208–209. ISBN 2881245692.
- ^ Rosenfeld, L. (1999). Four Centuries of Clinical Chemistry. CRC Press. pp. 72–75. ISBN 9056996452.
- ^ Harris, D.C. (2004). Exploring chemical analysis (3 ed.). Macmillan. pp. 111–112. ISBN 9780716705710.
- ^ Matar, S.; L.F. Hatch (2001). Chemistry of Petrochemical Processes (2 ed.). Gulf Professional Publishing. ISBN 0884153150.
- ^ Verma, Dr. N.K.; S.K. Khanna, Dr. B. Kapila. Comprehensive Chemistry XI. New Dehli: Laxmi Publications. pp. 642–645. ISBN 8170085969.
- ^ Patnaik, P. (2004). Dean's Analytical Chemistry Handbook (2 ed.). McGraw-Hill Prof Med/Tech. pp. 2.11–2.16. ISBN 0071410600.
- ^ Walther, J.V. (2005). Essentials of Geochemistry. Jones & Bartlett Learning. pp. 515–520. ISBN 0763726427.
- ^ Reger, D.L.; S.R. Goode, D.W. Ball (2009). Chemistry: Principles and Practice (3 ed.). Cengage Learning. pp. 684–693. ISBN 0534420125.
- ^ Bewick, S.; J. Edge, T. Forsythe, and R. Parsons (2009). CK12 Chemistry. CK-12 Foundation. pp. 794–797.
- ^ "pH measurements with indicators". http://www.ph-meter.info/pH-measurements-indicators. Retrieved 29 September 2011.
- ^ Vogel, A.I.; J. Mendham (2000). Vogel's textbook of quantitative chemical analysis (6 ed.). Prentice Hall. pp. 423. ISBN 0582226287.
- ^ Amerine, M.A.; M.A. Joslyn (1970). Table wines: the technology of their production. 2 (2 ed.). University of California Press. pp. 751–753. ISBN 0520016572.
- ^ German Chemical Society. Division of Analytical Chemistry (1959) (in German). Fresenius' Journal of Analytical Chemistry. 166-167. University of Michigan: J.F. Bergmann. pp. 1.
- ^ Hänsch, T.W. (2007). Metrology and Fundamental Constants. IOS Press. pp. 568. ISBN 1586037846.
- ^ "Gas phase titration". Bureau International des Poids et Mesures. http://www.bipm.fr/en/scientific/chem/gas_titration.html. Retrieved 29 September 2001.
- ^ DeMore, W.B.; M. Patapoff (September 1976). "Comparison of Ozone Determinations by Ultraviolet Photometry and Gas-Phase Titration". Environmental Science & Technology 10 (9): 897–899. doi:10.1021/es60120a012.
- ^ Khopkar, S.M. (1998). Basic Concepts of Analytical Chemistry (2 ed.). New Age International. pp. 63–76. ISBN 8122411592.
- ^ Somasundaran, P. (2006). "Calculation of Zeta-Potentials from Electrokinetic Data". Encyclopedia of Surface and Colloid Science (CRC Press) 2: 1097. ISBN 0849396077.
- ^ Dukhin, A.S.; P.J. Goetz (2002). Ultrasound for Characterizing Colloids: Particle sizing, Zeta potential, Rheology. Studies in Interface Science. 15. Elsevier. pp. 256–263. ISBN 0444511644.
- ^ Decker, J.M. (2000). Introduction to immunology. Eleventh Hour (3 ed.). Wiley-Blackwell. pp. 18–20. ISBN 0632044152.
- ^ "Titration". Science & Technology Encyclopedia. McGraw-Hill. http://www.answers.com/topic/titration. Retrieved 30 September 2011.
- ^ Harris, D.C. (2003). Quantitative Chemical Analysis (6 ed.). Macmillan. pp. 129. ISBN 0716744643.
- ^ Hannan, H.J. (2007). Technician's Formulation Handbook for Industrial and Household Cleaning Products. Lulu.com. pp. 103. ISBN 0615156010.
- ^ Kenkel, J. (2003). Analytical Chemistry for Technicians. 1 (3 ed.). CRC Press. pp. 108–109.
- ^ Purcella, G. (2007). Do It Yourself Guide to Biodiesel: Your Alternative Fuel Solution for Saving Money, Reducing Oil Dependency, Helping the Planet. Ulysses Press. pp. 81–96. ISBN 1569756244.
- ^ Remington: the science and practice of pharmacy. 1 (21 ed.). Lippincott Williams & Wilkins. 2005. pp. 501. ISBN 0781746736.
- ^ Spellman, F.R. (2009). Handbook of Water and Wastewater Treatment Plant Operations (2 ed.). CRC Press. pp. 545. ISBN 1420075306.
- ^ Biology. 3. London: Taylor & Francis. 1967. pp. 52.
- ^ Nigam (2007). Lab Manual Of Biochemistry. Tata McGraw-Hill Education. pp. 149. ISBN 0070617678.
- ^ Jackson, M.L.; P. Barak (2005). Soil Chemical Analysis: Advanced Course. UW-Madison Libraries Parallel Press. pp. 305–309. ISBN 1893311473.
External links
- Wikihow: Perform a Titration
- An interactive guide to titration
- Science Aid: A simple explanation of titrations including calculation examples
- Titration freeware - simulation of any pH vs. volume curve, distribution diagrams and real data analysis
|
|||||||||||||||||