Meta-analysis
In statistics, a meta-analysis combines the results of several studies that address a set of related research hypotheses. In its simplest form, this is normally by identification of a common measure of effect size, for which a weighted average might be the output of a meta-analysis. Here the weighting might be related to sample sizes within the individual studies. More generally there are other differences between the studies that need to be allowed for, but the general aim of a meta-analysis is to more powerfully estimate the true "effect size" as opposed to a smaller "effect size" derived in a single study under a given single set of assumptions and conditions.
Meta-analyses are often, but not always, important components of a systematic review procedure. Here it is convenient to follow the terminology used by the Cochrane Collaboration,[1] and use "meta-analysis" to refer to statistical methods of combining evidence, leaving other aspects of 'research synthesis' or 'evidence synthesis', such as combining information from qualitative studies, for the more general context of systematic reviews.
The term "meta-analysis" was coined by Gene V. Glass.[2]
Contents |
History
The first meta-analysis was performed by Karl Pearson in 1904, in an attempt to overcome the problem of reduced statistical power in studies with small sample sizes; analyzing the results from a group of studies can allow more accurate data analysis.[3][4] However, the first meta-analysis of all conceptually identical experiments concerning a particular research issue, and conducted by independent researchers, has been identified as the 1940 book-length publication Extra-sensory perception after sixty years, authored by Duke University psychologists J. G. Pratt, J. B. Rhine, and associates.[5] This encompassed a review of 145 reports on ESP experiments published from 1882 to 1939, and included an estimate of the influence of unpublished papers on the overall effect (the file-drawer problem). Although meta-analysis is widely used in epidemiology and evidence-based medicine today, a meta-analysis of a medical treatment was not published until 1955. In the 1970s, more sophisticated analytical techniques were introduced in educational research, starting with the work of Gene V. Glass, Frank L. Schmidt and John E. Hunter.
Gene V Glass was the first modern statistician to formalize the use of meta-analysis, and is widely recognized as the modern founder of the method. The online Oxford English Dictionary lists the first usage of the term in the statistical sense as 1976 by Glass.[2][6] The statistical theory surrounding meta-analysis was greatly advanced by the work of Nambury S. Raju, Larry V. Hedges, Harris Cooper, Ingram Olkin, John E. Hunter, Jacob Cohen, Thomas C. Chalmers, Robert Rosenthal and Frank L. Schmidt.
Advantages of meta-analysis
Advantages of meta-analysis (e.g. over classical literature reviews, simple overall means of effect sizes etc.) include:
- Shows if the results are more varied than what is expected from the sample diversity
- Derivation and statistical testing of overall factors / effect size parameters in related studies
- Generalization to the population of studies
- Ability to control for between-study variation
- Including moderators to explain variation
- Higher statistical power to detect an effect than in 'n=1 sized study sample'
- Deal with information overload: the high number of articles published each year.
- It combines several studies and will therefore be less influenced by local findings than single studies will be.
- Makes it possible to show if a publication bias exists.
Steps in a meta-analysis
1. Formulation of the problem
2. Search of literature
3. Selection of studies ('incorporation criteria')
- Based on quality criteria, e.g. the requirement of randomization and blinding in a clinical trial
- Selection of specific studies on a well-specified subject, e.g. the treatment of breast cancer.
- Decide whether unpublished studies are included to avoid publication bias (file drawer problem)
4. Decide which dependent variables or summary measures are allowed. For instance:
- Differences (discrete data)
- Means (continuous data)
- Hedges' g is a popular summary measure for continuous data that is standardized in order to eliminate scale differences, but it incorporates an index of variation between groups:
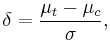 in which
  is the treatment mean,
  is the control mean,
  the pooled variance.
5. Model selection (see next paragraph)
For reporting guidelines, see QUOROM statement [7][8]
Meta-regression models
Generally, three types of models can be distinguished in the literature on meta-analysis: simple regression, fixed effect meta-regression and random effects meta-regression.
Simple regression
The model can be specified as

Where  is the effect size in study
  and
and  (intercept) the estimated overall effect size. The variables
  specify different characteristics of the study,
  specifies the between study variation. Note that this model does not allow specification of within study variation.
Fixed-effect meta-regression
Fixed-effect meta-regression assumes that the true effect size  is normally distributed with
  where
where  is the within study variance of the effect size. A fixed effect meta-regression model thus allows for within study variability, but no between study variability because all studies have the identical expected fixed effect size , i.e.
  . ***Note that for the "fixed-effect" no plural is used (in contrast to "random-effects") as only ONE true effect across all datasets is assumed.***

Here  is the variance of the effect size in study . Fixed effect meta-regression ignores between study variation. As a result, parameter estimates are biased if between study variation can not be ignored. Furthermore, generalizations to the population are not possible.
Random effects meta-regression
Random effects meta-regression rests on the assumption that in  is a random variable following a (hyper-)distribution
  A random effects meta-regression is called a mixed effects model when moderators are added to the model.

Here  is the variance of the effect size in study . Between study variance
  is estimated using common estimation procedures for random effects models (restricted maximum likelihood (REML) estimators).
Which model to choose
The simple regression model does not allow for within study variation, this yields in to significant results too easy. The fixed effects regression model does not allow for between study variation, this also yields in to significant results too easy. The random or mixed effects model allows for within study variation and between study variation and is therefore the most appropriate model to choose. Whether there is between study variation can be tested by testing whether the effect sizes are homogeneous. If the test shows that the effect sizes are not heterogeneous the fixed effects meta-regression might seem appropriate, however this test often does not have enough power to detect between study variation. Besides the lack of power of this test, you can reason that the fixed effects assumption of homogeneous effect sizes is rather weak, because it assumes that all studies are exactly the same. However you can assume that no two studies are exactly the same. To cope with the fact that each study is different (different sample; different time; different place; etc) a random or mixed effects model is always the appropriate model to choose and gives the most reliable results.
Applications in modern science
Modern statistical meta-analysis does more than just combine the effect sizes of a set of studies. It can test if the outcomes of studies show more variation than the variation that is expected because of sampling different research participants. If that is the case, study characteristics such as measurement instrument used, population sampled, or aspects of the studies' design are coded. These characteristics are then used as predictor variables to analyze the excess variation in the effect sizes. Some methodological weaknesses in studies can be corrected statistically. For example, it is possible to correct effect sizes or correlations for the downward bias due to measurement error or restriction on score ranges.
Meta-analysis can be done with single-subject design as well as group research designs. This is important because much of the research on low incidents populations has been done with single-subject research designs. Considerable dispute exists for the most appropriate meta-analytic technique for single subject research.[9]
Meta-analysis leads to a shift of emphasis from single studies to multiple studies. It emphasizes the practical importance of the effect size instead of the statistical significance of individual studies. This shift in thinking has been termed "meta-analytic thinking". The results of a meta-analysis are often shown in a forest plot.
Results from studies are combined using different approaches. One approach frequently used in meta-analysis in health care research is termed 'inverse variance method'. The average effect size across all studies is computed as a weighted mean, whereby the weights are equal to the inverse variance of each studies' effect estimator. Larger studies and studies with less random variation are given greater weight than smaller studies. Other common approaches include the Mantel–Haenszel method[10] and the Peto method.
A recent approach to studying the influence that weighting schemes can have on results has been proposed through the construct of gravity, which is a special case of combinatorial meta-analysis.
Signed differential mapping is a statistical technique for meta-analyzing studies on differences in brain activity or structure which used neuroimaging techniques such as fMRI, VBM or PET.
Weaknesses
Some have argued that a weakness of the method is that sources of bias are not controlled by the method. A good meta-analysis of badly designed studies will still result in bad statistics, according to Robert Slavin. Slavin has argued that only methodologically sound studies should be included in a meta-analysis, a practice he calls 'best evidence meta-analysis'. Other meta-analysts would include weaker studies, and add a study-level predictor variable that reflects the methodological quality of the studies to examine the effect of study quality on the effect size. However, Glass argued that the better approach preserves variance in the study sample, casting as wide a net as possible, and that methodological selection criteria introduce unwanted subjectivity, defeating the purpose of the approach.
File drawer problem
Another weakness of the method is the heavy reliance on published studies, which may create exaggerated outcomes, as it is very hard to publish studies that show no significant results. For any given research area, one cannot know how many studies have been conducted but never reported and the results filed away.[11]
This file drawer problem results in the distribution of effect sizes that are biased, skewed or completely cut off, creating a serious base rate fallacy, in which the significance of the published studies is overestimated. For example, if there were fifty tests, and only ten got results, then the real outcome is only 20% as significant as it appears, except that the other 80% were not submitted for publishing, or thrown out by publishers as uninteresting. This should be seriously considered when interpreting the outcomes of a meta-analysis.[11][12]
This can be visualized with a funnel plot which is a scatter plot of sample size and effect sizes. There are several procedures available that attempt to correct for the file drawer problem, once identified, such as guessing at the cut off part of the distribution of study effects.
Other weaknesses are Simpson's Paradox (two smaller studies may point in one direction, and the combination study in the opposite direction); the coding of an effect is subjective; the decision to include or reject a particular study is subjective; there are two different ways to measure effect: correlation or standardized mean difference; the interpretation of effect size is purely arbitrary; it has not been determined if the statistically most accurate method for combining results is the fixed effect model or the random effects model; and, for medicine, the underlying risk in each studied group is of significant importance, and there is no universally agreed-upon way to weight the risk.
The example provided by the Rind et al. controversy illustrates an application of meta-analysis which has been the subject of subsequent criticisms of many of the components of the meta-analysis.
Dangers of agenda-driven bias
The most severe weakness and abuse of meta-analysis often occurs when the person or persons doing the meta-analysis have an economic, social, or political agenda such as the passage or defeat of legislation. Those persons with these types of agenda have a high likelihood to abuse meta-analysis due to personal bias. For example, researchers favorable to the author's agenda are likely to have their studies "cherry picked" while those not favorable will be ignored or labeled as "not credible". In addition, the favored authors may themselves be biased or paid to produce results that support their overall political, social, or economic goals in ways such as selecting small favorable data sets and not incorporating larger unfavorable data sets.
If a meta-analysis is conducted by an individual or organization with a bias or predetermined desired outcome, it should be treated as highly suspect or having a high likelihood of being "junk science". From an integrity perspective, researchers with a bias should avoid meta-analysis and use a less abuse-prone (or independent) form of research.
A 2011 study done to disclose possible conflicts of interests in underlying research studies used for medical meta-analyses reviewed 29 meta-analyses and found that conflicts of interests in the studies underlying the meta-analyses were rarely disclosed. The 29 meta-analyses included 11 from general medicine journals; 15 from specialty medicine journals, and 3 from the Cochrane Database of Systematic Reviews. The 29 meta-analyses reviewed an aggregate of 509 randomized controlled trials (RCTs). Of these, 318 RCTs reported funding sources with 219 (69%) industry funded. 132 of the 509 RCTs reported author conflict of interest disclosures, with 91 studies (69%) disclosing industry financial ties with one or more authors. The information was, however, seldom reflected in the meta-analyses. Only two (7%) reported RCT funding sources and none reported RCT author-industry ties. The authors concluded “without acknowledgment of COI due to industry funding or author industry financial ties from RCTs included in meta-analyses, readers’ understanding and appraisal of the evidence from the meta-analysis may be compromised.”[13]
Comparison of meta-analysis to the scientific method
Francis Bacon described a method of procedure for advancing the physical sciences.[14]
“Aphorism 106: In forming our axioms from induction, we must examine and try whether the axiom we derive be only fitted and calculated for the particular instances from which it is deduced, or whether it be more extensive and general. If it be the latter, we must observe, whether it confirms its own extent and generality by giving surety, as it were, in pointing out new particulars, so that we may neither stop at actual discoveries, nor with a careless grasp catch at shadows and abstract forms, instead of substances of a determinate nature: and as soon as we act thus, well authorized hope may with reason, be said to beam upon us.”
George Boole gave a similar description [15] .
“The study of every department of physical science begins with observation; it advances by the collation of facts to a presumptive acquaintance with their connecting law, the validity of such presumption it tests by new experiments so devised as to augment, if the presumption be well founded, its probability indefinitely; and finally, the law of the phenomenon having been with sufficient confidence determined, the investigation of causes, conducted by the due mixture of hypothesis and deduction, crowns the inquiry.” (Boole, 1958, p. 402)
In both descriptions there are three steps:first assemble data, second formulate an explanatory physical law, and third test the proposed physical law in future experiments. In a meta analysis the first two steps are carried out, but the third step is modified. Meta-analysis being retrospective has no data gathered after the formulation of the physical law and so confirms the physical law using data that were known at the time the physical law was formulated. This requires a change from the usual notion of probability:
“Probability is expectation founded upon partial knowledge. A perfect acquaintance with all the circumstances affecting the occurrence of an event would change expectation into certainty, and leave neither room nor demand for a theory of probabilities.”(Boole, 1958, p. 402)
Statistical significance in a hypothesis test is the probability rejecting the null hypothesis when it is true. In the scientific method, statistical significance is the probability of a future event. In a meta-analysis, statistical significance is the probability of a past event.
In a meta-analysis the analyst has “perfect acquaintance with all the circumstances affecting the occurrence” of any event defined by the data at the time the hypotheses are specified. So there is no uncertainty and the probabilities of such events, using Boole’s notion of probability, would be zero or one. The procedure in meta-analysis is to simulate necessary incompleteness of knowledge by calculating the power and statistical significance as if none of the data were known to the analyst at the time the hypotheses were specified. A meta-analysis hypothesis test is, within the context of the scientific method of Bacon and Boole, a simulated hypothesis test.
See also
- Epidemiologic methods
- Newcastle–Ottawa scale
- Reporting bias
- Review journal
- Study heterogeneity
- Systematic review
References
- ^ Glossary at Cochrane Collaboration
- ^ a b Glass, G. V (1976). "Primary, secondary, and meta-analysis of research". Educational Researcher, 5, 3-8.
- ^ O'Rourke, Keith (2007-12-01). "An historical perspective on meta-analysis: dealing quantitatively with varying study results". J R Soc Med 100 (12): 579–582. doi:10.1258/jrsm.100.12.579. PMC 2121629. PMID 18065712. http://jrsm.rsmjournals.com. Retrieved 2009-09-10.
- ^ Egger, M; G D Smith (1997-11-22). "Meta-Analysis. Potentials and promise". BMJ (Clinical Research Ed.) 315 (7119): 1371–1374. ISSN 0959-8138. PMC 2127866. PMID 9432250. http://www.bmj.com/content/315/7119/1371.full. Retrieved 2009-09-10.
- ^ Bösch, H. (2004). Reanalyzing a meta-analysis on extra-sensory perception dating from 1940, the first comprehensive meta-analysis in the history of science. In S. Schmidt (Ed.), Proceedings of the 47th Annual Convention of the Parapsychological Association, University of Vienna, (pp. 1–13)
- ^ meta-analysis. Oxford English Dictionary. Oxford University Press. Draft Entry June 2008. Accessed 28 March 2009. "1976 G. V. Glass in Educ. Res. Nov. 3/2 My major interest currently is in what we have come to call..the meta-analysis of research. The term is a bit grand, but it is precise and apt... Meta-analysis refers to the analysis of analyses."
- ^ http://www.consort-statement.org/resources/related-guidelines-and-initiatives/
- ^ http://www.consort-statement.org/index.aspx?o=1346
- ^ Van den Noortgate, W. & Onghena, P. (2007). Aggregating Single-Case Results. The Behavior Analyst Today, 8(2), 196–209 BAO
- ^ Mantel, N.; Haenszel, W. (1959). "Statistical aspects of the analysis of data from the retrospective analysis of disease". Journal of the National Cancer Institute 22 (4): 719–748. PMID 13655060.
- ^ a b Rosenthal, Robert (1979). "The "File Drawer Problem" and the Tolerance for Null Results". Psychological Bulletin 86 (3): 638–641. doi:10.1037/0033-2909.86.3.638
- ^ Hunter, John E; Schmidt, Frank L (1990). Methods of Meta-Analysis: Correcting Error and Bias in Research Findings. Newbury Park, California; London; New Delhi: SAGE Publications
- ^ http://www.cochrane.org/news/blog/how-well-do-meta-analyses-disclose-conflicts-interests-underlying-research-studies
- ^ Bacon, Francis (1952), Novum Organum in Great Books of the Western World, Chicago: Encyclopedia Britannica
- ^ Boole, George (1958). An investigation of the laws of thought on which are founded the mathematical theories of logic and probabilities. New York: Dover. pp. 424. ISBN 0-486-60028-9.
- Cooper, H. & Hedges, L.V. (1994). The Handbook of Research Synthesis. New York: Russell Sage.
- Cornell, J. E. & Mulrow, C. D. (1999). Meta-analysis. In: H. J. Adèr & G. J. Mellenbergh (Eds). Research Methodology in the social, behavioral and life sciences (pp. 285–323). London: Sage.
- Norman, S.-L. T. (1999). Tutorial in Biostatistics. Meta-Analysis: Formulating, Evaluating, Combining, and Reporting. Statistics in Medicine, 18, 321–359.
- Sutton, A.J., Jones, D.R., Abrams, K.R., Sheldon, T.A., & Song, F. (2000). Methods for Meta-analysis in Medical Research. London: John Wiley. ISBN 0-471-49066-0
- Higgins JPT, Green S (editors). Cochrane Handbook for Systematic Reviews of Interventions Version 5.0.1 [updated September 2008]. The Cochrane Collaboration, 2008. Available from www.cochrane-handbook.org
Further reading
- Thompson, Simon G; Pocock, Stuart J (2 November 1991). "Can meta-analysis be trusted?". The Lancet 338 (8775): 1127–1130. doi:10.1016/0140-6736(91)91975-Z. PMID 1682553. http://tobaccodocuments.org/pm/2047231315-1318.pdf. Retrieved 17 June 2011. Explores two contrasting views: does meta-analysis provide "objective, quantitative methods for combining evidence from separate but similar studies" or merely "statistical tricks which make unjustified assumptions in producing oversimplified generalisations out of a complex of disparate studies"?
- Wilson, D. B., & Lipsey, M. W. (2001). Practical meta-analysis. Thousand Oaks: Sage publications. ISBN 0761921680
- O'Rourke, K. (2007) Just the history from the combining of information: investigating and synthesizing what is possibly common in clinical observations or studies via likelihood. Oxford: University of Oxford, Department of Statistics. Gives technical background material and details on the "An historical perspective on meta-analysis" paper cited in the references.
- Owen, A. B. (2009). "Karl Pearson's meta-analysis revisited". Annals of Statistics, 37 (6B), 3867–3892. Supplementary report.
- Ellis, Paul D. (2010). The Essential Guide to Effect Sizes: An Introduction to Statistical Power, Meta-Analysis and the Interpretation of Research Results. United Kingdom: Cambridge University Press. ISBN 0521142466
- Bonett, D.G. (2009). Meta-analytic interval estimation for standardized and unstandardized mean differences, Psychological Methods, 14, 225-238.
External links
- Cochrane Handbook for Systematic Reviews of Interventions
- Effect Size and Meta-Analysis (ERIC Digest)
- Meta-Analysis at 25 (Gene V Glass)
- Meta-Analysis in Educational Research (ERIC Digest)
- Meta-Analysis: Methods of Accumulating Results Across Research Domains (article by Larry Lyons)
- Meta-analysis (Psychwiki.com article)
- EffectSizeFAQ.com
- Meta-Analysis in Economics (Reading list)
- Preferred Reporting Items for Systematic Reviews and Meta-Analyses (PRISMA) Statement, "an evidence-based minimum set of items for reporting in systematic reviews and meta-analyses."
Software
- Effect Size Calculators Calculate d and r from a variety of statistics.
- ClinTools (commercial)
- Comprehensive Meta-Analysis (commercial)
- MIX 2.0 Professional Excel addin with Ribbon interface for meta-analysis and effect size conversions in Excel (free and commercial versions).
- What meta-analysis features are available in Stata? (free add-ons to commercial package)
- The Meta-Analysis Calculator free on-line tool for conducting a meta-analysis
- Metastat (Free)
- Meta-Analyst Free Windows-based tool for Meta-Analysis of binary, continuous and diagnostic data
- Revman A free software for meta-analysis and preparation of cochrane protocols and review available from the Cochrane Collaboration
- Metafor-project A free software package to conduct meta-analyses in R.
- Calculation of fixed and random effects in R source code for performing univariate and multivariate meta-analyses in R, and for calculating several statistics of heterogeneity.
- Macros in SPSS Free Macros to conduct meta-analyses in SPSS.
|
|||||||||||||||||||||||||||||||||||||||||||||||||||||||||||||||||||||||||||||||||||||||||||||||||||||||||||||||||||||||||||||||||||||||||||