Küttigkofen
| Küttigkofen | ||||||||||
|---|---|---|---|---|---|---|---|---|---|---|
|
||||||||||
| Population | 255 (Dec 2010)[1] | |||||||||
| - Density | 120 /km2 (310 /sq mi) | |||||||||
| Area | 2.13 km2 (0.82 sq mi)[2] | |||||||||
| Elevation | 481 m (1,578 ft) | |||||||||
| Postal code | 4581 | |||||||||
| SFOS number | 2452 | |||||||||
| Surrounded by | Bätterkinden (BE), Brügglen, Kyburg-Buchegg, Lüterkofen-Ichertswil | |||||||||
| Website | www.kuettigkofen.ch SFSO statistics |
|||||||||
|
Küttigkofen
|
||||||||||
|
Map of Küttigkofen
|
||||||||||
Küttigkofen is a municipality in the district of Bucheggberg, in the canton of Solothurn, Switzerland.
Contents |
History
Küttigkofen is first mentioned in 1316 as obrenchúttenkouen.[3]
Geography
Küttigkofen has an area, as of 2009[update], of 2.13 square kilometers (0.82 sq mi). Of this area, 1.3 km2 (0.50 sq mi) or 61.0% is used for agricultural purposes, while 0.67 km2 (0.26 sq mi) or 31.5% is forested. Of the rest of the land, 0.18 km2 (0.069 sq mi) or 8.5% is settled (buildings or roads), 0.01 km2 (2.5 acres) or 0.5% is either rivers or lakes.[4]
Of the built up area, housing and buildings made up 3.8% and transportation infrastructure made up 4.2%. Out of the forested land, all of the forested land area is covered with heavy forests. Of the agricultural land, 36.6% is used for growing crops and 22.1% is pastures, while 2.3% is used for orchards or vine crops. All the water in the municipality is flowing water.[4]
The municipality is located in the Bucheggberg district, at the end of the Müli valley. It consists of the village of Küttigkofen and scattered settlements.
Coat of arms
The blazon of the municipal coat of arms is Or a Beech Tree eradicated Vert and in a Chief Azure six Doves Argent volant to Dexter.[5]
Demographics
Küttigkofen has a population (as of December 2010[update]) of 255.[1] As of 2008[update], 4.5% of the population are resident foreign nationals.[6] Over the last 10 years (1999–2009 ) the population has changed at a rate of 2%.[7]
Most of the population (as of 2000[update]) speaks German (237 or 98.8%), with French and English each being spoken by 1 person.[8]
As of 2008[update], the gender distribution of the population was 48.2% male and 51.8% female. The population was made up of 117 Swiss men (47.0% of the population) and 3 (1.2%) non-Swiss men. There were 124 Swiss women (49.8%) and 5 (2.0%) non-Swiss women.[9] Of the population in the municipality 85 or about 35.4% were born in Küttigkofen and lived there in 2000. There were 69 or 28.8% who were born in the same canton, while 70 or 29.2% were born somewhere else in Switzerland, and 15 or 6.3% were born outside of Switzerland.[8]
In 2008[update] there was 1 live birth to Swiss citizens and were 4 deaths of Swiss citizens. Ignoring immigration and emigration, the population of Swiss citizens decreased by 3 while the foreign population remained the same. There was 1 Swiss woman who immigrated back to Switzerland. At the same time, there was 1 non-Swiss woman who immigrated from another country to Switzerland. The total Swiss population change in 2008 (from all sources, including moves across municipal borders) was a decrease of 3 and the non-Swiss population increased by 2 people. This represents a population growth rate of -0.4%.[6]
The age distribution, as of 2000[update], in Küttigkofen is; 19 children or 7.9% of the population are between 0 and 6 years old and 43 teenagers or 17.9% are between 7 and 19. Of the adult population, 18 people or 7.5% of the population are between 20 and 24 years old. 61 people or 25.4% are between 25 and 44, and 68 people or 28.3% are between 45 and 64. The senior population distribution is 24 people or 10.0% of the population are between 65 and 79 years old and there are 7 people or 2.9% who are over 80.[10]
As of 2000[update], there were 102 people who were single and never married in the municipality. There were 114 married individuals, 10 widows or widowers and 14 individuals who are divorced.[8]
As of 2000[update] the average number of residents per living room was 0.54 which is about equal to the cantonal average of 0.56 per room. In this case, a room is defined as space of a housing unit of at least 4 m2 (43 sq ft) as normal bedrooms, dining rooms, living rooms, kitchens and habitable cellars and attics.[11] About 73.8% of the total households were owner occupied, or in other words did not pay rent (though they may have a mortgage or a rent-to-own agreement).[12]
As of 2000[update], there were 89 private households in the municipality, and an average of 2.7 persons per household.[7] There were 20 households that consist of only one person and 12 households with five or more people. Out of a total of 89 households that answered this question, 22.5% were households made up of just one person. Of the rest of the households, there are 26 married couples without children, 37 married couples with children There were 4 single parents with a child or children. There were 2 households that were made up of unrelated people.[8]
In 2000[update] there were 49 single family homes (or 69.0% of the total) out of a total of 71 inhabited buildings. There were 6 multi-family buildings (8.5%), along with 14 multi-purpose buildings that were mostly used for housing (19.7%) and 2 other use buildings (commercial or industrial) that also had some housing (2.8%). Of the single family homes 10 were built before 1919, while 10 were built between 1990 and 2000.[13]
In 2000[update] there were 86 apartments in the municipality. The most common apartment size was 5 rooms of which there were 24. There were single room apartments and 50 apartments with five or more rooms. Of these apartments, a total of 84 apartments (97.7% of the total) were permanently occupied, while 2 apartments (2.3%) were seasonally occupied.[13] As of 2009[update], the construction rate of new housing units was 0 new units per 1000 residents.[7] The vacancy rate for the municipality, in 2010[update], was 0%.[7]
The historical population is given in the following chart:[3][14] 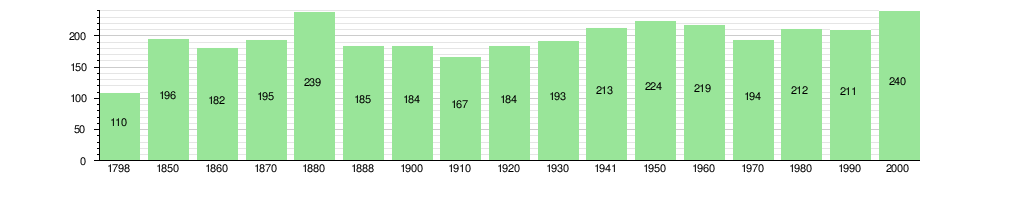
Politics
In the 2007 federal election the most popular party was the FDP which received 35.55% of the vote. The next three most popular parties were the SVP (22.12%), the SP (18.8%) and the Green Party (10.61%). In the federal election, a total of 115 votes were cast, and the voter turnout was 54.5%.[15]
Economy
As of 2010[update], Küttigkofen had an unemployment rate of 0.8%. As of 2008[update], there were 22 people employed in the primary economic sector and about 9 businesses involved in this sector. 2 people were employed in the secondary sector and there was 1 business in this sector. 39 people were employed in the tertiary sector, with 6 businesses in this sector.[7] There were 130 residents of the municipality who were employed in some capacity, of which females made up 42.3% of the workforce.
In 2008[update] the total number of full-time equivalent jobs was 46. The number of jobs in the primary sector was 11, all of which were in agriculture. The number of jobs in the secondary sector was 1, all of which were in construction. The number of jobs in the tertiary sector was 34. In the tertiary sector; 2 or 5.9% were in the sale or repair of motor vehicles, 3 or 8.8% were in the movement and storage of goods, 4 or 11.8% were in a hotel or restaurant, 1 was a technical professional or scientist, .[16]
In 2000[update], there were 44 workers who commuted into the municipality and 97 workers who commuted away. The municipality is a net exporter of workers, with about 2.2 workers leaving the municipality for every one entering.[17] Of the working population, 14.6% used public transportation to get to work, and 56.2% used a private car.[7]
Religion
From the 2000 census[update], 37 or 15.4% were Roman Catholic, while 165 or 68.8% belonged to the Swiss Reformed Church. Of the rest of the population, there was 1 member of an Orthodox church, and there were 3 individuals (or about 1.25% of the population) who belonged to another Christian church. There were there was 1 individual who was Islamic. 33 (or about 13.75% of the population) belonged to no church, are agnostic or atheist,FALSE[8]
Education
In Küttigkofen about 95 or (39.6%) of the population have completed non-mandatory upper secondary education, and 45 or (18.8%) have completed additional higher education (either university or a Fachhochschule). Of the 45 who completed tertiary schooling, 64.4% were Swiss men, 33.3% were Swiss women.[8]
As of 2000[update], there were 15 students in Küttigkofen who came from another municipality, while 38 residents attended schools outside the municipality.[17]
References
- ^ a b Canton Solothurn Statistical Office, MS Excel document – Bevölkerungsbestand nach Gemeinden 31.12.2010 (German) accessed 29 March 2011
- ^ Arealstatistik Standard - Gemeindedaten nach 4 Hauptbereichen
- ^ a b Küttigkofen in German, French and Italian in the online Historical Dictionary of Switzerland.
- ^ a b Swiss Federal Statistical Office-Land Use Statistics 2009 data (German) accessed 25 March 2010
- ^ Flags of the World.com accessed 21-March-2011
- ^ a b Swiss Federal Statistical Office - Superweb database - Gemeinde Statistics 1981-2008 (German) accessed 19 June 2010
- ^ a b c d e f Swiss Federal Statistical Office accessed 21-March-2011
- ^ a b c d e f STAT-TAB Datenwürfel für Thema 40.3 - 2000 (German) accessed 2 February 2011
- ^ Canton of Solothurn Statistics - Wohnbevölkerung der Gemeinden nach Nationalität und Geschlecht (German) accessed 11 March 2011
- ^ Canton of Solothurn Statistics - Wohnbevölkerung nach Gemeinden, Nationalität, Altersgruppen und Zivilstand, Total (Männer + Frauen) (German) accessed 11 March 2011
- ^ Eurostat. "Housing (SA1)" (pdf). Urban Audit Glossary. 2007. p. 18. http://www.bfs.admin.ch/bfs/portal/en/index/international/22/lexi.Document.116365.pdf. Retrieved 12 February 2010.
- ^ Urban Audit Glossary pg 17
- ^ a b Federal Statistical Office STAT-TAB - Datenwürfel für Thema 09.2 - Gebäude und Wohnungen (German) accessed 28 January 2011
- ^ Swiss Federal Statistical Office STAT-TAB Bevölkerungsentwicklung nach Region, 1850-2000 (German) accessed 29 January 2011
- ^ Swiss Federal Statistical Office, Nationalratswahlen 2007: Stärke der Parteien und Wahlbeteiligung, nach Gemeinden/Bezirk/Canton (German) accessed 28 May 2010
- ^ Swiss Federal Statistical Office STAT-TAB Betriebszählung: Arbeitsstätten nach Gemeinde und NOGA 2008 (Abschnitte), Sektoren 1-3 (German) accessed 28 January 2011
- ^ a b Swiss Federal Statistical Office - Statweb (German) accessed 24 June 2010
|
|
|||||||