Isotopes of carbon
Carbon (C) has 16 known isotopes, from 8C to 23C, 2 of which (12C and 13C) are stable. The longest-lived radioisotope is 14C with a half-life of 5,700 years. This is also the only carbon radioisotope found in nature, where trace quantities are formed cosmogenically by the reaction 14N + 1n -> 14C + 1H. The most stable artificial radioisotope is 11C, with a half-life of 20.334 minutes. All other radioisotopes have half-lives under 20 seconds, most less than 200 milliseconds. The least stable isotope is 8C, with a half-life of 2.0 x 10⁻²¹ s.
Standard atomic mass: 12.0107(8) u
Contents |
Carbon-11
Carbon-11 or 11C is a radioactive isotope of carbon. It decays 100% by positron emission to boron-11. It has a half-life of 20.38 minutes.
Carbon-11 is commonly used as a radioisotope to radioactive labeling of molecules in positron emission tomography. Among the many molecules used in this context is the radioligand [11
C]DASB.
Natural isotopes
There are 3 naturally occurring isotopes of carbon: 12, 13, and 14. 12C and 13C are stable, occurring in a natural proportion of approximately 99:1. 14C is produced by thermal neutrons from cosmic radiation in the upper atmosphere, and is transported down to earth to be absorbed by living biological material. Isotopically the 14C constitutes a negligible part, but since it is radioactive with a half-life of 5700 years, it is radiometrically detectable. Since dead tissue doesn't absorb 14C, the amount of 14C is used for radiometric dating of biological material, among others within the field of archeology.
Table
| nuclide symbol |
Z(p) | N(n) | isotopic mass (u) |
half-life | decay mode(s)[1] | daughter isotope(s)[n 1] |
nuclear spin |
representative isotopic composition (mole fraction) |
range of natural variation (mole fraction) |
|---|---|---|---|---|---|---|---|---|---|
| 8C | 6 | 2 | 8.037675(25) | 2.0(4) x 10−21 s [230(50) keV] |
2p | 6 Be[n 2] |
0+ | ||
| 9C | 6 | 3 | 9.0310367(23) | 126.5(9) ms | β+ (60%) | 9 B[n 3] |
(3/2-) | ||
| β+, p (23%) | 8 Be[n 4] |
||||||||
| β+, α (17%) | 5 Li[n 5] |
||||||||
| 10C | 6 | 4 | 10.0168532(4) | 19.290(12) s | β+ | 10 B |
0+ | ||
| 11C[n 6] | 6 | 5 | 11.0114336(10) | 20.334(24) min | β+ | 11 B |
3/2- | ||
| 12C | 6 | 6 | 12 exactly[n 7] | Stable | 0+ | 0.9893(8) | 0.98853-0.99037 | ||
| 13C[n 8] | 6 | 7 | 13.0033548378(10) | Stable | 1/2- | 0.0107(8) | 0.00963-0.01147 | ||
| 14C[n 9] | 6 | 8 | 14.003241989(4) | 5.70(3) x 103 years | β− | 14 N |
0+ | Trace[n 10] | <10−12 |
| 15C | 6 | 9 | 15.0105993(9) | 2.449(5) s | β− | 15 N |
1/2+ | ||
| 16C | 6 | 10 | 16.014701(4) | 0.747(8) s | β−, n (97.9%) | 15 N |
0+ | ||
| β− (2.1%) | 16 N |
||||||||
| 17C | 6 | 11 | 17.022586(19) | 193(5) ms | β− (71.59%) | 17 N |
(3/2+) | ||
| β−, n (28.41%) | 16 N |
||||||||
| 18C | 6 | 12 | 18.02676(3) | 92(2) ms | β− (68.5%) | 18 N |
0+ | ||
| β−, n (31.5%) | 17 N |
||||||||
| 19C[n 11] | 6 | 13 | 19.03481(11) | 46.2(23) ms | β−, n (47.0%) | 18 N |
(1/2+) | ||
| β− (46.0%) | 19 N |
||||||||
| β−, 2n (7%) | 17 N |
||||||||
| 20C | 6 | 14 | 20.04032(26) | 16(3) ms [14(+6-5) ms] |
β−, n (72.0%) | 19 N |
0+ | ||
| β− (28.0%) | 20 N |
||||||||
| 21C | 6 | 15 | 21.04934(54)# | <30 ns | n | 20 C |
(1/2+)# | ||
| 22C[n 12] | 6 | 16 | 22.05720(97)# | 6.2(13) ms [6.1(+14-12) ms] |
β− | 22 N |
0+ | ||
- ^ Bold for stable isotopes
- ^ Subsequently decays by double proton emission to 4He for a net reaction of 8C -> 4He + 41H
- ^ Immediately decays by proton emission to 8Be, which immediately decays to two 4He atoms for a net reaction of 9C -> 24He + 1H + e+
- ^ Immediately decays into two 4He atoms for a net reaction of 9C -> 24He + 1H + e+
- ^ Immediately decays by proton emission to 4He for a net reaction of 9C -> 24He + 1H + e+
- ^ Used for labeling molecules in PET scans
- ^ The unified atomic mass unit is defined as 1/12 the mass of an unbound atom of Carbon-12 at ground state
- ^ Ratio of 12C to 13C used to measure biological productivity in ancient times and differing types of photosynthesis
- ^ Has an important use in radiodating (see carbon dating)
- ^ Primarily cosmogenic, produced by neutrons striking atoms of 14N (14N + 1n -> 14C + 1H)
- ^ Has 1 halo neutron
- ^ Has 2 halo neutrons
Notes
- The precision of the isotope abundances and atomic mass is limited through variations. The given ranges should be applicable to any normal terrestrial material.
- Values marked # are not purely derived from experimental data, but at least partly from systematic trends. Spins with weak assignment arguments are enclosed in parentheses.
- Uncertainties are given in concise form in parentheses after the corresponding last digits. Uncertainty values denote one standard deviation, except isotopic composition and standard atomic mass from IUPAC which use expanded uncertainties.
- 12C is of particular importance as it is used as the standard from which atomic masses of all nuclides are measured: its atomic mass is by definition 12.
Paleoclimate
12C and 13C are measured as the isotope ratio δ13C in benthic foraminifera and used as a proxy for nutrient cycling and the temperature dependant air-sea exchange of CO2 (ventilation) (Lynch-Stieglitz et al., 1995). Plants find it easier to use the lighter isotopes (12C) when they convert sunlight and carbon dioxide into food. So, for example, large blooms of plankton (free-floating organisms) absorb large amounts of 12C from the oceans. The 12C was originally mostly incorporated into the seawater from the atmosphere. If the oceans the plankton live in are stratified (meaning that there are layers of warm water near the top, and colder water deeper down) the surface water does not mix with deeper waters very much, so that when the plankton dies it sinks and takes away 12C from the surface, leaving the surface layers relatively rich in 13C. Where cold waters well up from the depths (such as in the North Atlantic) it carries 12C back up with it. So, when the ocean was less stratified than today, there was much more 12C in the skeletons of surface-dwelling species. Other indicators of past climate include the presence of tropical species, coral growths rings, etc. (Flannery, 2005)
Tracing food sources and diets
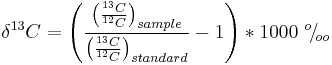
The quantities of the different isotopes can be measured by mass spectrometry and compared to a standard; the result (e.g. the delta of the 13C = δ13C) is expressed as parts per thousand (‰).
Stable carbon isotopes in carbon dioxide are utilized differentially by plants during photosynthesis. Grasses in temperate environments (barley, rice, wheat, rye and oats, plus sunflower, potato, tomatoes, peanuts, cotton, sugar beet, and most trees and their nuts/fruits, roses and Kentucky bluegrass) follow a C3 photosynthetic pathway that will yield δ13C values averaging about −26.5‰. Grasses in hot arid environments (maize in particular, but also millet, sorghum, sugar cane and crabgrass) follow a C4 photosynthetic pathway that produces δ13C values averaging about −12.5‰.
It follows that eating these different plants will affect the δ13C values in the consumer’s body tissues. If an animal (or human) eats only C3 plants, their δ13C values will be −12.5‰ in their bone collagen and −14.5‰ in their apatite.[2]
In contrast, C4 feeders will have bone collagen with a value of −7.5‰ and apatite value of −0.5‰.
In actual case studies, millet and maize eaters can easily be distinguished from rice and wheat eaters. Studying how these dietary preferences are distributed geographically through time can illuminate migration paths of people and dispersal paths of different agricultural crops. However, human groups have often mixed C3 and C4 plants (northern Chinese historically subsisted on wheat and millet), or mixed plant and animal groups together (for example, southeastern Chinese subsisting on rice and fish). [3]
References
- ^ http://www.nucleonica.net/unc.aspx
- ^ Tycot, R.H. (2004) “Stable isotopes and diet: you are what you eat.” Proceedings of the International School of Physics ‘Enrico Fermi’Course CLIV, edited by M. Martini, M. Milazzo and M. Piacentini. Amsterdam: IOS Press.
- ^ Hedges Richard (2006). "Where does our protein come from?". British Journal of Nutrition 95: 1031–2.
- Flannery, T 2005, The weather makers: the history & future of climate change, The Text Publishing Company, Melbourne, Australia. ISBN 1920885 84 6.
- Isotope masses from:
- G. Audi, A. H. Wapstra, C. Thibault, J. Blachot and O. Bersillon (2003). "The NUBASE evaluation of nuclear and decay properties". Nuclear Physics A 729: 3–128. Bibcode 2003NuPhA.729....3A. doi:10.1016/j.nuclphysa.2003.11.001. http://www.nndc.bnl.gov/amdc/nubase/Nubase2003.pdf.
- Isotopic compositions and standard atomic masses from:
- J. R. de Laeter, J. K. Böhlke, P. De Bièvre, H. Hidaka, H. S. Peiser, K. J. R. Rosman and P. D. P. Taylor (2003). "Atomic weights of the elements. Review 2000 (IUPAC Technical Report)". Pure and Applied Chemistry 75 (6): 683–800. doi:10.1351/pac200375060683. http://www.iupac.org/publications/pac/75/6/0683/pdf/.
- M. E. Wieser (2006). "Atomic weights of the elements 2005 (IUPAC Technical Report)". Pure and Applied Chemistry 78 (11): 2051–2066. doi:10.1351/pac200678112051. http://iupac.org/publications/pac/78/11/2051/pdf/. Lay summary.
- Half-life, spin, and isomer data selected from the following sources. See editing notes on this article's talk page.
- G. Audi, A. H. Wapstra, C. Thibault, J. Blachot and O. Bersillon (2003). "The NUBASE evaluation of nuclear and decay properties". Nuclear Physics A 729: 3–128. Bibcode 2003NuPhA.729....3A. doi:10.1016/j.nuclphysa.2003.11.001. http://www.nndc.bnl.gov/amdc/nubase/Nubase2003.pdf.
- National Nuclear Data Center. "NuDat 2.1 database". Brookhaven National Laboratory. http://www.nndc.bnl.gov/nudat2/. Retrieved September 2005.
- N. E. Holden (2004). "Table of the Isotopes". In D. R. Lide. CRC Handbook of Chemistry and Physics (85th ed.). CRC Press. Section 11. ISBN 978-0849304859.
| Isotopes of boron | Isotopes of carbon | Isotopes of nitrogen |
| Index to isotope pages · Table of nuclides | ||