Graph of a function
In mathematics, the graph of a function f is the collection of all ordered pairs (x, f(x)). In particular, if x is a real number, graph means the graphical representation of this collection, in the form of a curve on a Cartesian plane, together with Cartesian axes, etc. Graphing on a Cartesian plane is sometimes referred to as curve sketching. If the function input x is an ordered pair (x1, x2) of real numbers, the graph is the collection of all ordered triples (x1, x2, f(x1, x2)), and its graphical representation is a surface (see three dimensional graph).
The graph of a function on real numbers is identical to the graphic representation of the function. For general functions, the graphic representation cannot be applied and the formal definition of the graph of a function suits the need of mathematical statements, e.g., the closed graph theorem in functional analysis.
The concept of the graph of a function is generalized to the graph of a relation. Note that although a function is always identified with its graph, they are not the same because it will happen that two functions with different codomain could have the same graph. For example, the cubic polynomial mentioned below is a surjection if its codomain is the real numbers but it is not if its codomain is the complex field.
To test if a graph of a curve is a function, use the vertical line test. To test if the function is one-to-one, meaning it has an inverse function, use the horizontal line test. If the function has an inverse, the graph of the inverse can be found by reflecting the graph of the original function over the line  . A curve is a one-to-one function if and only if it is a function and it passes the horizontal line test.
In science, engineering, technology, finance, and other areas, graphs are tools used for many purposes. In the simplest case one variable is plotted as a function of another, typically using rectangular axes; see Plot (graphics) for details.
Contents |
Examples
Functions of one variable
The graph of the function.
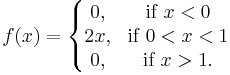
is
- {(x<0,0), (0<x<1,2x), (x>1,0)}.
The graph of the cubic polynomial on the one variable
is
- {(x, x3-9x) : x is a real number}.
If this set is plotted on a Cartesian plane, the result is a curve (see figure).
Functions of two variables
The graph of the trigonometric function on the real line
is
If this set is plotted on a three dimensional Cartesian coordinate system, the result is a surface (see figure).
Tools for plotting function graphs
Hardware
Software
See also
External links
- Weisstein, Eric W. "Function Graph." From MathWorld--A Wolfram Web Resource.