Forecasting
Forecasting is the process of making statements about events whose actual outcomes (typically) have not yet been observed. A commonplace example might be estimation for some variable of interest at some specified future date. Prediction is a similar, but more general term. Both might refer to formal statistical methods employing time series, cross-sectional or longitudinal data, or alternatively to less formal judgemental methods. Usage can differ between areas of application: for example in hydrology, the terms "forecast" and "forecasting" are sometimes reserved for estimates of values at certain specific future times, while the term "prediction" is used for more general estimates, such as the number of times floods will occur over a long period. Risk and uncertainty are central to forecasting and prediction; it is generally considered good practice to indicate the degree of uncertainty attaching to forecasts. The process of climate change and increasing energy prices has led to the usage of Egain Forecasting of buildings. The method uses Forecasting to reduce the energy needed to heat the building, thus reducing the emission of greenhouse gases. Forecasting is used in the practice of Customer Demand Planning in every day business forecasting for manufacturing companies. Forecasting has also been used to predict the development of conflict situations. Research has shown that there is little difference between the accuracy of forecasts performed by experts knowledgeable of the conflict situation of interest and that performed by individuals who knew much less.[1] The discipline of demand planning, also sometimes referred to as supply chain forecasting, embraces both statistical forecasting and a consensus process. An important, albeit often ignored aspect of forecasting, is the relationship it holds with planning. Forecasting can be described as predicting what the future will look like, whereas planning predicts what the future should look like.[2][3] There is no single right forecasting method to use. Selection of a method should be based on your objectives and your conditions (data etc.).[4] A good place to find a method, is by visiting a selection tree. An example of a selection tree can be found here.[5]
Contents |
Categories of forecasting methods
Qualitative vs. Quantitative Methods
Qualitative forecasting techniques are subjective, based on the opinion and judgment of consumers, experts; appropriate when past data is not available. It is usually applied to intermediate-long range decisions.
Example of qualitative forecasting methods:
- Informed opinion and judgment
- Delphi method
- Market research
- Historical life-cycle Analogy.
Quantitative forecasting models are used to estimate future demands as a function of past data; appropriate when past data is available. It is usually applied to short-intermediate range decisions.
Example of Quantitative forecasting methods:
- Last period demand
- Arithmetic Average
- Simple Moving Average (N-Period)
- Weighted Moving Average (N-period)
- Simple Exponential Smoothing
- Multiplicative Seasonal Indexes
Naïve Approach
Naïve forecasts are the most cost-effective and efficient objective forecasting model, and provide a benchmark against which more sophisticated models can be compared. For stable time series data, this approach says that the forecast for any period equals the previous period's actual value.
Time series methods
Time series methods use historical data as the basis of estimating future outcomes.
- Moving average
- Weighted moving average
- Exponential smoothing
- Autoregressive moving average (ARMA)
- Autoregressive integrated moving average (ARIMA)
- e.g. Box-Jenkins
Causal / econometric forecasting methods
Some forecasting methods use the assumption that it is possible to identify the underlying factors that might influence the variable that is being forecast. For example, including information about weather conditions might improve the ability of a model to predict umbrella sales. This is a model of seasonality which shows a regular pattern of up and down fluctuations. In addition to weather, seasonality can also be due to holidays and customs such as predicting that sales in college football apparel will be higher during football season as opposed to the off season. [6]
Casual forecasting methods are also subject to the discretion of the forecaster. There are several informal methods which do not have strict algorithms, but rather modest and unstructured guidance. One can forecast based on, for example, linear relationships. If one variable is linearly related to the other for a long enough period of time, it may be beneficial to predict such a relationship in the future. This is quite different from the aforementioned model of seasonality whose graph would more closely resemble a sine or cosine wave. The most important factor when performing this operation is using concrete and substantiated data. Forecasting off of another forecast produces inconclusive and possibly erroneous results.
Such methods include:
- Regression analysis includes a large group of methods that can be used to predict future values of a variable using information about other variables. These methods include both parametric (linear or non-linear) and non-parametric techniques.
Judgmental methods
Judgmental forecasting methods incorporate intuitive judgements, opinions and subjective probability estimates.
- Composite forecasts
- Surveys
- Delphi method
- Scenario building
- Technology forecasting
- Forecast by analogy
Artificial intelligence methods
Other methods
- Simulation
- Prediction market
- Probabilistic forecasting and Ensemble forecasting
- Reference class forecasting
Forecasting accuracy
The forecast error is the difference between the actual value and the forecast value for the corresponding period.

where E is the forecast error at period t, Y is the actual value at period t, and F is the forecast for period t.
Measures of aggregate error:
| Mean absolute error (MAE) | 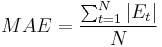 |
| Mean Absolute Percentage Error (MAPE) | 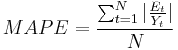 |
| Mean Absolute Deviation (MAD) | 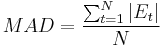 |
| Percent Mean Absolute Deviation (PMAD) | 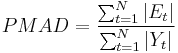 |
| Mean squared error (MSE) | 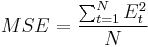 |
| Root Mean squared error (RMSE) | 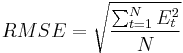 |
| Forecast skill (SS) | 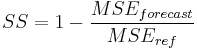 |
| Average of Errors (E) | 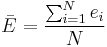 |
Please note that business forecasters and practitioners sometimes use different terminology in the industry. They refer to the PMAD as the MAPE, although they compute this volume weighted MAPE. For more information see Calculating Demand Forecast Accuracy
Reference class forecasting was developed to increase forecasting accuracy.[8]
See also
- Forecast error
- Calculating Demand Forecast Accuracy
- Consensus forecasts
- Predictability
- Prediction interval, similar to confidence interval
Applications of forecasting
Forecasting has application in many situations:
- Supply chain management - Forecasting can be used in Supply Chain Management to make sure that the right product is at the right place at the right time. Accurate forecasting will help retailers reduce excess inventory and therefore increase profit margin. Accurate forecasting will also help them meet consumer demand.
- Weather forecasting, Flood forecasting and Meteorology
- Transport planning and Transportation forecasting
- Economic forecasting
- Egain Forecasting
- Technology forecasting
- Earthquake prediction
- Land use forecasting
- Product forecasting
- Player and team performance in sports
- Telecommunications forecasting
- Political Forecasting
- Sales Forecasting
See also
References
- ^ Kesten C. Greene and J. Scott Armstrong (2007). "The Ombudsman: Value of Expertise for Forecasting Decisions in Conflicts". INFORMS. pp. 1–12. http://marketing.wharton.upenn.edu/documents/research/Value%20of%20expertise.pdf.
- ^ http://www.forecastingprinciples.com/index.php?option=com_content&task=view&id=3&Itemid=3
- ^ Kesten C. Greene and J. Scott Armstrong (2007). [http://qbox.wharton.upenn.edu/documents/mktg/research/INTFOR3581%20-%20Publication% 2015.pdf "Structured analogies for forecasting"]. pp. 365–376. http://qbox.wharton.upenn.edu/documents/mktg/research/INTFOR3581%20-%20Publication% 2015.pdf.
- ^ http://www.forecastingprinciples.com/index.php?option=com_content&task=view&id=3&Itemid=3#D._Choosing_the_best_method
- ^ http://www.forecastingprinciples.com/index.php?option=com_content&task=view&id=17&Itemid=17
- ^ Nahmias, Steven (2009). Production and Operations Analysis.
- ^ Ellis, Kimberly (2008). Production Planning and Inventory Control Virginia Tech. McGraw Hill. ISBN 978-0390871060.
- ^ Flyvbjerg, B., 2008, "Curbing Optimism Bias and Strategic Misrepresentation in Planning: Reference Class Forecasting in Practice." European Planning Studies, vol. 16, no. 1, January, pp. 3-21.
- Armstrong, J. Scott (ed.) (2001) (in English). Principles of forecasting: a handbook for researchers and practitioners. Norwell, Massachusetts: Kluwer Academic Publishers. ISBN 0-7923-7930-6.
- Flyvbjerg, Bent, 2008, "Curbing Optimism Bias and Strategic Misrepresentation in Planning: Reference Class Forecasting in Practice," European Planning Studies, vol. 16, no. 1, January, pp. 3-21.
- Ellis, Kimberly (2010) (in English). Production Planning and Inventory Control. McGraw-Hill. ISBN 0-412-03471-9.
- Geisser, Seymour (1 June 1993) (in English). Predictive Inference: An Introduction. Chapman & Hall, CRC Press. ISBN 0-39-087106-0.
- Gilchrist, Warren (1976) (in English). Statistical Forecasting. London: John Wiley & Sons. ISBN 0-471-99403-0.
- Hyndman, R.J., Koehler, A.B (2005) "Another look at measures of forecast accuracy", Monash University note.
- Makridakis, Spyros; Wheelwright, Steven; Hyndman, Rob J. (1998) (in English). Forecasting: methods and applications. New York: John Wiley & Sons. ISBN 0-471-53233-9. http://www.robjhyndman.com/forecasting/.
- Kress, George J.; Snyder, John (30 May 1994) (in English). Forecasting and market analysis techniques: a practical approach. Westport, Connecticut, London: Quorum Books. ISBN 0-89930-835-X.
- Rescher, Nicholas (1998) (in English). Predicting the future: An introduction to the theory of forecasting. State University of New York Press. ISBN 0791435539.
- Taesler, R. (1990/91) Climate and Building Energy Management. Energy and Buildings, Vol. 15-16, pp 599 – 608.
- Turchin, P. (2007) "Scientific Prediction in Historical Sociology: Ibn Khaldun meets Al Saud". In:History & Mathematics: Historical Dynamics and Development of Complex Societies. Moscow: KomKniga. ISBN 978-5-484-01002-8
- Sasic Kaligasidis, A et al. (2006) Upgraded weather forecast control of building heating systems. p. 951 ff in Research in Building Physics and Building Engineering Paul Fazio (Editorial Staff), ISBN 0-415-41675-6
- United States Patent 6098893 Comfort control system incorporating weather forecast data and a method for operating such a system (Inventor Stefan Berglund)
External links
- Forecasting Principles: "Evidence-based forecasting"
- Introduction to Time series Analysis (Engineering Statistics Handbook) - A practical guide to Time series analysis and forecasting
- Time Series Analysis
- Global Forecasting with IFs
- Earthquake Electromagnetic Precursor Research