Dielectric spectroscopy
Dielectric spectroscopy (sometimes called impedance spectroscopy), and also known as electrochemical impedance spectroscopy, measures the dielectric properties of a medium as a function of frequency.[1][2][3][4] It is based on the interaction of an external field with the electric dipole moment of the sample, often expressed by permittivity.
It is also an experimental method of characterizing electrochemical systems. This technique measures the impedance of a system over a range of frequencies, and therefore the frequency response of the system, including the energy storage and dissipation properties, is revealed. Often, data obtained by EIS is expressed graphically in a Bode plot or a Nyquist plot.
Impedance is the opposition to the flow of alternating current (AC) in a complex system. A passive complex electrical system comprises both energy dissipater (resistor) and energy storage (capacitor) elements. If the system is purely resistive, then the opposition to AC or direct current (DC) is simply resistance.
Almost any physico-chemical system, such as electrochemical cells, mass-beam oscillators, and even biological tissue possesses energy storage and dissipation properties. EIS examines them.
This technique has grown tremendously in stature over the past few years and is now being widely employed in a wide variety of scientific fields such as fuel cell testing, biomolecular interaction, and microstructural characterization. Often, EIS reveals information about the reaction mechanism of an electrochemical process: different reaction steps will dominate at certain frequencies, and the frequency response shown by EIS can help identify the rate limiting step.
Contents |
Dielectric mechanisms
There are a number of different dielectric mechanisms, connected to the way a studied medium reacts to the applied field (see the figure illustration). Each dielectric mechanism is centered around its characteristic frequency, which is the reciprocal of the characteristic time of the process. In general, dielectric mechanisms can be divided into relaxation and resonance processes. The most common, starting from high frequencies, are:
Electronic polarization
This resonant process occurs in a neutral atom when the electric field displaces the electron density relative to the nucleus it surrounds.
This displacement occurs due to the equilibrium between restoration and electric forces. Electronic polarization may be understood by assuming an atom as a point nucleus surrounded by spherical electron cloud of uniform charge density.
Atomic polarization
Atomic polarization is observed when the electronic cloud is deformed under the force of the applied field, so that the negative and positive charge are formed. This is a resonant process.
Dipole relaxation
This originates from permanent and induced dipoles aligning to an electric field. Their orientation polarisation is disturbed by thermal noise (which mis-aligns the dipole vectors from the direction of the field), and the time needed for dipoles to relax is determined by the local viscosity. These two facts make dipole relaxation heavily dependent on temperature and chemical surrounding.
Ionic relaxation
Ionic relaxation comprises ionic conductivity and interfacial and space charge relaxation. Ionic conductivity predominates at low frequencies and introduces only losses to the system. Interfacial relaxation occurs when charge carriers are trapped at interfaces of heterogeneous systems. A related effect is Maxwell-Wagner-Sillars polarization, where charge carriers blocked at inner dielectric boundary layers (on the mesoscopic scale) or external electrodes (on a macroscopic scale) lead to a separation of charges. The charges may be separated by a considerable distance and therefore make contributions to the dielectric loss that are orders of magnitude larger than the response due to molecular fluctuations.[1]
Dielectric relaxation
Dielectric relaxation as a whole is the result of the movement of dipoles (dipole relaxation) and electric charges (ionic relaxation) due to an applied alternating field, and is usually observed in the frequency range 102-1010 Hz. Relaxation mechanisms are relatively slow compared to resonant electronic transitions or molecular vibrations, which usually have frequencies above 1012 Hz.
Principles
Steady-state
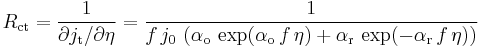
For a redox reaction R  O + e, without mass-transfer limitation, the relationship between the current density and the electrode overpotential is given by the Butler-Volmer equation:

with
 .
.  is the exchange current density and
  and
and  are the symmetry factors.
The curve  is not a straight line (Fig. 1), therefore a redox reaction is not a linear system.[5]
Dynamic behavior
Faradaic impedance
Let us suppose that the Butler-Volmer relationship correctly describes the dynamic behavior of the redox reaction :

Dynamic behavior of the redox reaction is characterized by the so-called charge transfer resistance defined by :
The value of the charge transfer resistance changes with the overpotential. For this simplest example the Faradaic impedance is reduced to a resistance. It is worthwhile to notice that:

for  .
.
Double layer capacitance
An electrode  electrolyte interface behaves like a capacitance called electrochemical double-layer capacitance
  . The equivalent electrical circuit for the redox reaction taking account of the double-layer capacitance is shown in Fig. 2. Another analog circuit commonly used to model the electrochemical double-layer is called a constant phase element.
The electrical impedance of this circuit is easily obtained remembering the impedance of a capacitance which is given by :
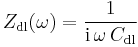
where  is the angular frequency of a sinusoidal signal (rd/s), and
  . It is obtained :
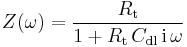
Nyquist diagram of the impedance of the circuit shown in Fig. 3 is a semicircle with a diameter  and an angular frequency at the apex equal to
  (Fig. 3). Others representations, Bode or Black plans can be used.[6]
Ohmic resistance
The ohmic resistance  appears in series with the electrode impedance of the reaction and the Nyquist diagram is translated to the right.
Measurement of the impedance parameters
Plotting the Nyquist diagram with a potentiostat [7] and an impedance analyzer, most often included in modern potentiostats, allows the user to determine charge transfer resistance, double layer capacitance and ohmic resistance. The exchange current density can be easily determined measuring the impedance of a redox reaction for .
Nyquist diagrams are made of several arcs for reaction more complex than redox reaction and with mass-transfer limitation.
See also
- loss tangent
- Debye relaxation
- Ellipsometry
- Linear response function
- Kramers–Kronig relation
- Green–Kubo relations
- Electrochemistry
- Potentiostat
References
- ^ a b Kremer F., Schonhals A., Luck W. Broadband Dielectric Spectroscopy. – Springer-Verlag, 2002.
- ^ Sidorovich A. M., Dielectric Spectrum of Water. – Ukrainian Physical Journal, 1984, vol. 29, No 8, p. 1175-1181 (In Russian).
- ^ Hippel A. R. Dielectrics and Waves. – N. Y.: John Willey & Sons, 1954.
- ^ Volkov A. A., Prokhorov A. S., Broadband Dielectric Spectroscopy of Solids. – Radiophysics and Quantum Electronics, 2003, vol. 46, Issue 8, p. 657–665.
- ^ Linear vs. non-linear systems in impedance measurements
- ^ "Potentiostat stability mystery explained" (PDF). http://www.bio-logic.info/potentiostat/notes/Application%20note%204.pdf. Retrieved 2011-11-08.
- ^ Impedance, admittance, Nyquist, Bode, Black, etc.