Assortativity
Assortativity is a preference for a network's nodes to attach to others that are similar or different in some way. Though the specific measure of similarity may vary, network theorists often examine assortativity in terms of a node's degree[1]. The addition of this characteristic to network models more closely approximates the behaviors of many real world networks.
Correlations between nodes of similar degree are often found in the mixing patterns of many observable networks. For instance, in social networks, highly connected nodes tend to be connected with other high degree nodes. This tendency is referred to as assortative mixing, or assortativity. On the other hand, technological and biological networks typically show disassortative mixing, or dissortativity, as high degree nodes tend to attach to low degree nodes[2].
Contents |
Measuring assortativity
Assortativity is often operationalized as a correlation between two nodes. However, there are several ways to capture such a correlation. The two most prominent measures are the assortativity coefficient and the neighbor connectivity. These measures are outlined in more detail below.
Assortativity coefficient
The assortativity coefficient is essentially the Pearson correlation coefficient of degree between pairs of linked nodes[2]. Hence, positive values of r indicate a correlation between nodes of similar degree, while negative values indicate relationships between nodes of different degree. In general, r lies between −1 and 1. When r = 1, the network is said to have perfect assortative mixing patterns, while at r = −1 the network is completely disassortative.
The assortativity coefficient is given by 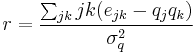 . The term
  is the distribution of the remaining degree. This captures the number of edges leaving the node, other than the one that connects the pair. The distribution of this term is derived from the degree distribution
  as
as 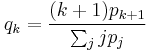 . Finally,
  refers to the joint probability distribution of the remaining degrees of the two vertices. This quantity is symmetric on an undirected graph, and follows the sum rules
  and
and  .
.
Neighbor connectivity
Another means of capturing the degree correlation is by examining the properties of  , or the average degree of neighbors of a node with degree k[5]. This term is formally defined as:
 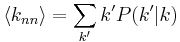 , where
  is the conditional probability that an edge of node degree k points to a node with degree k'. If this function is increasing, the network is assortative, since it shows that nodes of high degree connect, on average, to nodes of high degree. Alternatively, if the function is decreasing, the network is dissortative, since nodes of high degree tend to connect to nodes of lower degree. The function can be plotted on a graph (see Fig. 2) to depict the overall assortativity trend for a network.
Assortative mixing patterns of real networks
The assortative patterns of a variety of real world networks have been examined. For instance, Fig. 3 lists values of r for a variety of networks. Note that the social networks (the first five entries) have apparent assortative mixing. On the other hand, the technological and biological networks (the middle six entries) all appear to be disassortative. It has been suggested that this is because most networks have a tendency to evolve, unless otherwise constrained, towards their maximum entropy state—which is usually disassortative[6].
The table also has the value of r calculated analytically for two models of networks:
- the random graph of Erdos and Renyi
- BA Model (Barabási and Albert model)
In the ER model, since edges are placed at random without regard to vertex degree, it follows that r = 0 in the limit of large graph size. Interestingly, the scale-free BA model also holds this property. For the BA model,  as
as  in the limit of large
  .[2].
.[2].
Application
The properties of assortativity are useful in the field of epidemiology, since they can help understand the spread of disease or cures. For instance, the removal of a portion of a network's vertices may correspond to curing, vaccinating, or quarantining individuals or cells. Since social networks demonstrate assortative mixing, diseases targeting high degree individuals are likely to spread to other high degree nodes. Alternatively, within the cellular network—which, as a biological network is likely dissortative—vaccination strategies that specifically target the high degree vertices may quickly destroy the epidemic network.
References
- ^ M.E.J. Newman. Mixing patterns in networks. Phys. Rev. E 67, 026126 (2003).
- ^ a b c d M.E.J. Newman. Assortative mixing in networks. Phys. Rev. Lett. 89, 208701 (2002).
- ^ R. Xulvi-Brunet and I.M. Sokolov. Changing correlations in networks: assortativity and dissortativity. Acta Phys. Pol. B, 36, 1431 (2005).
- ^ Sang Hoon Lee, Pan-Jun Kim, and Hawoong Jeong. Statistical properties of sampled networks. Phys. Rev. E 73 016102 (2006).
- ^ Pastor-Satorras, Romualdo, Alexei Vázquez, and Alessandro Vespignani. Dynamical and Correlation Properties of the Internet. Phys. Rev. Lett. 87 (2001).
- ^ S. Johnson, J.J. Torres, J. Marro, and M.A. Muñoz. Entropic origin of disassortativity in complex networks. Phys. Rev. Lett. 104, 108702 (2010).