Map projection

A map projection is any method of representing the surface of a sphere or other shape on a plane. Map projections are necessary for creating maps. All map projections distort the surface in some fashion. Depending on the purpose of the map, some distortions are acceptable and others are not; therefore different map projections exist in order to preserve some properties of the sphere-like body at the expense of other properties. There is no limit to the number of possible map projections.
| Views |
|---|
|
Graphical projections
Other views
|
For simplicity this article usually assumes that the surface to be mapped is the surface of a sphere. However, the Earth and other sufficiently large celestial bodies are generally better modeled as oblate spheroids, and small objects such as asteroids may have irregular shapes. These other surfaces can be mapped as well. Therefore, more generally, a map projection is any method of "flattening" into a plane a continuous surface having curvature in all three spatial dimensions.
"Projection" as used here is not limited to perspective projections, such as those resulting from casting a shadow on a screen. Rather, any mathematical function transforming coordinates from the curved surface to the plane is a projection.
Carl Friedrich Gauss's Theorema Egregium proved that a sphere cannot be represented on a plane without distortion. Since any method of representing a sphere's surface on a plane is a map projection, all map projections distort. Every distinct map projection distorts in a distinct way. The study of map projections is the characterization of these distortions.
A map of the earth is a representation of a curved surface on a plane. Therefore a map projection must have been used to create the map, and, conversely, maps could not exist without map projections. Maps can be more useful than globes in many situations: they are more compact and easier to store; they readily accommodate an enormous range of scales; they are viewed easily on computer displays; they can facilitate measuring properties of the terrain being mapped; they can show larger portions of the earth's surface at once; and they are cheaper to produce and transport. These useful traits of maps motivate the development of map projections.
Metric properties of maps
Many properties can be measured on the earth's surface independently of its geography. Some of these properties are:

Map projections can be constructed to preserve one or more of these properties, though not all of them simultaneously. Each projection preserves or compromises or approximates basic metric properties in different ways. The purpose of the map determines which projection should form the base for the map. Because many purposes exist for maps, many projections have been created to suit those purposes.
Another major concern that drives the choice of a projection is the compatibility of data sets. Data sets are geographic information. As such, their collection depends on the chosen model of the Earth. Different models assign slightly different coordinates to the same location, so it is important that the model be known and that the chosen projection be compatible with that model. On small areas (large scale) data compatibility issues are more important since metric distortions are minimal at this level. In very large areas (small scale), on the other hand, distortion is a more important factor to consider.
Construction of a map projection
The creation of a map projection involves three steps:
- Selection of a model for the shape of the Earth or planetary body (usually choosing between a sphere or ellipsoid). Because the Earth's actual shape is irregular, information is lost in this step.
- Transformation of geographic coordinates (longitude and latitude) to plane coordinates (eastings and northings or x,y)
- Reduction of the scale (it does not matter in what order the second and third steps are performed)
Most map projections are not "projections" in any physical sense. Rather, they depend on mathematical formulae that have no direct physical interpretation. However, in understanding the concept of a map projection it can be helpful to think of a globe with a light source placed at some definite point relative to it, projecting features of the globe onto a surface. The following discussion of developable surfaces is based on that concept.
Choosing a projection surface

A surface that can be unfolded or unrolled into a plane or sheet without stretching, tearing or shrinking is called a 'developable surface'. The cylinder, cone and of course the plane are all developable surfaces. The sphere and ellipsoid are not developable surfaces. As noted in the introduction, any projection of a sphere (or an ellipsoid) onto a plane will have to distort the image. (To compare, you cannot flatten an orange peel without tearing or warping it.)
One way of describing a projection is first to project from the earth's surface to a developable surface such as a cylinder or cone, and then to unroll the surface into a plane. While the first step inevitably distorts some properties of the globe, the developable surface can then be unfolded without further distortion.
Orientation of the projection

Once a choice is made between projecting onto a cylinder, cone, or plane, the orientation of the shape must be chosen. The orientation is how the shape is placed relative to the globe. The orientation of the projection surface can be normal (such that the surface's axis of symmetry coincides with the earth's axis), transverse (at right angles to the earth's axis) or oblique (any angle in between). These surfaces may also be either tangent or secant to the spherical or ellipsoidal globe. Tangent means the surface touches but does not slice through the globe; secant means the surface does slice through the globe. Insofar as preserving metric properties goes, it is never advantageous to move the developable surface away from contact with the globe, so that possibility is not discussed here.
Scale
A globe is the only way to represent the earth with constant scale throughout the entire map in all directions. A map cannot achieve that property for any area, no matter how small. It can, however, achieve constant scale along specific lines.
Some possible properties are:
- The scale depends on location, but not on direction. This is equivalent to preservation of angles, the defining characteristic of a conformal map.
- Scale is constant along any parallel in the direction of the parallel. This applies for any cylindrical or pseudocylindrical projection in normal aspect.
- Combination of the above: the scale depends on latitude only, not on longitude or direction. This applies for the Mercator projection in normal aspect.
- Scale is constant along all straight lines radiating from two particular geographic locations. This is the defining characteristic an equidistant projection, such as the Azimuthal equidistant projection or the Equirectangular projection.
Choosing a model for the shape of the Earth
Projection construction is also affected by how the shape of the Earth is approximated. In the following discussion on projection categories, a sphere is assumed. However, the Earth is not exactly spherical but is closer in shape to an oblate ellipsoid, a shape which bulges around the equator. Selecting a model for a shape of the Earth involves choosing between the advantages and disadvantages of a sphere versus an ellipsoid. Spherical models are useful for small-scale maps such as world atlases and globes, since the error at that scale is not usually noticeable or important enough to justify using the more complicated ellipsoid. The ellipsoidal model is commonly used to construct topographic maps and for other large and medium scale maps that need to accurately depict the land surface.
A third model of the shape of the Earth is called a geoid, which is a complex and more or less accurate representation of the global mean sea level surface that is obtained through a combination of terrestrial and satellite gravity measurements. This model is not used for mapping due to its complexity but is instead used for control purposes in the construction of geographic datums. (In geodesy, plural of "datum" is "datums" rather than "data".) A geoid is used to construct a datum by adding irregularities to the ellipsoid in order better to match the Earth's actual shape (it takes into account the large scale features in the Earth's gravity field associated with mantle convection patterns, as well as the gravity signatures of very large geomorphic features such as mountain ranges, plateaus and plains). Historically, datums have been based on ellipsoids that best represent the geoid within the region the datum is intended to map. Each ellipsoid has a distinct major and minor axis. Different controls (modifications) are added to the ellipsoid in order to construct the datum, which is specialized for a specific geographic regions (such as the North American Datum). A few modern datums, such as WGS84 (the one used in the Global Positioning System GPS), are optimized to represent the entire earth as well as possible with a single ellipsoid, at the expense of some accuracy in smaller regions.
Classification
A fundamental projection classification is based on the type of projection surface onto which the globe is conceptually projected. The projections are described in terms of placing a gigantic surface in contact with the earth, followed by an implied scaling operation. These surfaces are cylindrical (e.g. Mercator), conic (e.g., Albers), or azimuthal or plane (e.g. stereographic). Many mathematical projections, however, do not neatly fit into any of these three conceptual projection methods. Hence other peer categories have been described in the literature, such as pseudoconic (meridians are arcs of circles), pseudocylindrical (meridians are straight lines), pseudoazimuthal, retroazimuthal, and polyconic.
Another way to classify projections is according to properties of the model they preserve. Some of the more common categories are:
- Preserving direction (azimuthal), a trait possible only from one or two points to every other point
- Preserving shape locally (conformal or orthomorphic)
- Preserving area (equal-area or equiareal or equivalent or authalic)
- Preserving distance (equidistant), a trait possible only between one or two points and every other point
- Preserving shortest route, a trait preserved only by the gnomonic projection
NOTE: Because the sphere is not a developable surface, it is impossible to construct a map projection that is both equal-area and conformal.
Projections by surface
Cylindrical

The term "cylindrical projection" is used to refer to any projection in which meridians are mapped to equally spaced vertical lines and circles of latitude (parallels) are mapped to horizontal lines (or, mutatis mutandis, more generally, radial lines from a fixed point are mapped to equally spaced parallel lines and concentric circles around it are mapped to perpendicular lines).
The mapping of meridians to vertical lines can be visualized by imagining a cylinder (of which the axis coincides with the Earth's axis of rotation) wrapped around the Earth and then projecting onto the cylinder, and subsequently unfolding the cylinder.
By the geometry of their construction, cylindrical projections stretch distances east-west. The amount of stretch is the same at any chosen latitude on all cylindrical projections, and is given by the secant of the latitude as a multiple of the equator's scale. The various cylindrical projections are distinguished from each other solely by their north-south stretching (where latitude is given by φ):
- North-south stretching is equal to the east-west stretching (secant φ): The east-west scale matches the north-south scale: conformal cylindrical or Mercator; this distorts areas excessively in high latitudes (see also transverse Mercator).
- North-south stretching growing rapidly with latitude, even faster than east-west stretching (secant² φ: The cylindric perspective (= central cylindrical) projection; unsuitable because distortion is even worse than in the Mercator projection.
- North-south stretching grows with latitude, but less quickly than the east-west stretching: such as the Miller cylindrical projection (secant[4φ/5]).
- North-south distances neither stretched nor compressed (1): equidistant cylindrical or plate carrée.
- North-south compression precisely the reciprocal of east-west stretching (cosine φ): equal-area cylindrical (with many named specializations such as Gall-Peters or Gall orthographic, Behrmann, and Lambert cylindrical equal-area). This divides north-south distances by a factor equal to the secant of the latitude, preserving area but heavily distorting shapes.
In the first case (Mercator), the east-west scale always equals the north-south scale. In the second case (central cylindrical), the north-south scale exceeds the east-west scale everywhere away from the equator. Each remaining case has a pair of identical latitudes of opposite sign (or else the equator) at which the east-west scale matches the north-south-scale.
Cylindrical projections map the whole Earth as a finite rectangle, except in the first two cases, where the rectangle stretches infinitely tall while retaining constant width.
Pseudocylindrical

Pseudocylindrical projections represent the central meridian and each parallel as a single straight line segment, but not the other meridians. Each pseudocylindrical projection represents a point on the Earth along the straight line representing its parallel, at a distance which is a function of its difference in longitude from the central meridian.
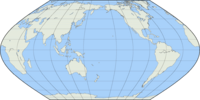
- Sinusoidal: the north-south scale and the east-west scale are the same throughout the map, creating an equal-area map. On the map, as in reality, the length of each parallel is proportional to the cosine of the latitude. Thus the shape of the map for the whole earth is the region between two symmetric rotated cosine curves.[1]
The true distance between two points on the same meridian corresponds to the distance on the map between the two parallels, which is smaller than the distance between the two points on the map. The true distance between two points on the same parallel – and the true area of shapes on the map – are not distorted. The meridians drawn on the map help the user to realize the shape distortion and mentally compensate for it.
- Collignon projection, which in its most common forms represents each meridian as 2 straight line segments, one from each pole to the equator.
- Mollweide
- Goode homolosine
- Eckert IV
- Eckert VI
- Kavrayskiy VII
- Tobler hyperelliptical
Hybrid
The HEALPix projection combines an equal-area cylindrical projection in equatorial regions with the Collignon projection in polar areas.
Conical
- Equidistant conic
- Lambert conformal conic
- Albers conic
Pseudoconical
- Bonne
- Werner cordiform designates a pole and a meridian; distances from the pole are preserved, as are distances from the meridian (which is straight) along the parallels
- Continuous American polyconic
Azimuthal (projections onto a plane)

Azimuthal projections have the property that directions from a central point are preserved (and hence, great circles through the central point are represented by straight lines on the map). Usually these projections also have radial symmetry in the scales and hence in the distortions: map distances from the central point are computed by a function r(d) of the true distance d, independent of the angle; correspondingly, circles with the central point as center are mapped into circles which have as center the central point on the map.
The mapping of radial lines can be visualized by imagining a plane tangent to the Earth, with the central point as tangent point.
The radial scale is r'(d) and the transverse scale r(d)/(R sin(d/R)) where R is the radius of the Earth.
Some azimuthal projections are true perspective projections; that is, they can be constructed mechanically, projecting the surface of the Earth by extending lines from a points of perspective (along an infinite line through the tangent point and the tangent point's antipode) onto the plane:
- The gnomonic projection displays great circles as straight lines. Can be constructed by using a point of perspective at the center of the Earth. r(d) = c tan(d/R); a hemisphere already requires an infinite map,[2][3]
- The General Perspective Projection can be constructed by using a point of perspective outside the earth. Photographs of Earth (such as those from the International Space Station) give this perspective.
- The orthographic projection maps each point on the earth to the closest point on the plane. Can be constructed from a point of perspective an infinite distance from the tangent point; r(d) = c sin(d/R).[4] Can display up to a hemisphere on a finite circle. Photographs of Earth from far enough away, such as the Moon, give this perspective.
- The azimuthal conformal projection, also known as the stereographic projection, can be constructed by using the tangent point's antipode as the point of perspective. r(d) = c tan(d/2R); the scale is c/(2R cos²(d/2R)).[5] Can display nearly the entire sphere on a finite circle. The full sphere requires an infinite map.
Other azimuthal projections are not true perspective projections:
- Azimuthal equidistant: r(d) = cd; it is used by amateur radio operators to know the direction to point their antennas toward a point and see the distance to it. Distance from the tangent point on the map is proportional to surface distance on the earth (;[6] for the case where the tangent point is the North Pole, see the flag of the United Nations)
- Lambert azimuthal equal-area. Distance from the tangent point on the map is proportional to straight-line distance through the earth: r(d) = c sin(d/2R)[7]
- Logarithmic azimuthal is constructed so that each point's distance from the center of the map is the logarithm of its distance from the tangent point on the Earth. Works well with cognitive maps. r(d) = c ln(d/d0); locations closer than at a distance equal to the constant d0 are not shown (,[8] figure 6-5)
Projections by preservation of a metric property

Conformal
Conformal map projections preserve angles locally:
- Mercator - rhumb lines are represented by straight segments
- Stereographic - shape of circles is conserved
- Roussilhe
- Lambert conformal conic
- Quincuncial map
- Adams hemisphere-in-a-square projection
- Guyou hemisphere-in-a-square projection
Equal-area

These projections preserve area:
- Gall orthographic (also known as Gall-Peters, or Peters, projection)
- Albers conic
- Lambert azimuthal equal-area
- Mollweide
- Hammer
- Briesemeister
- Sinusoidal
- Werner
- Bonne
- Bottomley
- Goode's homolosine
- Hobo-Dyer
- Collignon
- Tobler hyperelliptical
Equidistant
These preserve distance from some standard point or line:
- Plate carrée - distances along meridians are conserved
- Equirectangular - a Plate carrée centered at the equator.
- Azimuthal equidistant - distances along great circles radiating from centre are conserved

- Equidistant conic
- sinusoidal - distances along parallels are conserved
- Werner cordiform distances from the North Pole are correct as are the curved distance on parallels
- Soldner
- Two-point equidistant: two "control points" are arbitrarily chosen by the map maker. Distance from any point on the map to each control point is proportional to surface distance on the earth.
Gnomonic

Great circles are displayed as straight lines:
- Gnomonic projection
Retroazimuthal
Direction to a fixed location B (the bearing at the starting location A of the shortest route) corresponds to the direction on the map from A to B:
- Littrow - the only conformal retroazimuthal projection
- Hammer retroazimuthal - also preserves distance from the central point
- Craig retroazimuthal aka Mecca or Qibla - also has vertical meridians
Compromise projections

Compromise projections give up the idea of perfectly preserving metric properties, seeking instead to strike a balance between distortions, or to simply make things "look right". Most of these types of projections distort shape in the polar regions more than at the equator:
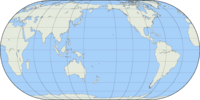
- Robinson
- van der Grinten
- Miller cylindrical
- Winkel Tripel
- Buckminster Fuller's Dymaxion
- B.J.S. Cahill's Butterfly Map
- Steve Waterman's Butterfly Map
- Kavrayskiy VII
- Wagner VI
Other noteworthy projections
- Chamberlin trimetric
- The French cartographer Oronce Fine developed a heart-shaped projection in the sixteenth century
See also
- World map
- Reversed map
- Cartography
- Cartographer
- Geographic information system (GIS)
- Graphical projection
- Orthographic projection
- Axonometric projection
- Trimetric projection
- Isometric projection
- Dimetric projection
- Axonometric projection
- Oblique projection
- Orthogonal projection
- Perspective projection
- Orthographic projection
- Plans (drawings)
- Brain mapping
References
- Fran Evanisko, American River College, lectures for Geography 20: "Cartographic Design for GIS", Fall 2002
- Snyder, J.P., Album of Map Projections, United States Geological Survey Professional Paper 1453, United States Government Printing Office, 1989.
- Snyder, John P. (1987). Map Projections - A Working Manual. U.S. Geological Survey Professional Paper 1395. United States Government Printing Office, Washington, D.C.. This paper can be downloaded from USGS pages
- ↑ "Sinusoidal Projection -- From MathWorld". Retrieved on November 18, 2005.
- ↑ "Gnomonic Projection -- From MathWorld". Retrieved on November 18, 2005.
- ↑ "The Gnomonic Projection". Retrieved on November 18, 2005.
- ↑ "Orthographic Projection -- From MathWorld". Retrieved on November 18, 2005.
- ↑ "Stereographic Projection -- From MathWorld". Retrieved on November 18, 2005.
- ↑ "Azimuthal Equidistant Projection -- From MathWorld". Retrieved on November 18, 2005.
- ↑ "Lambert Azimuthal Equal-Area Projection -- From MathWorld". Retrieved on November 18, 2005.
- ↑ "http://www.gis.psu.edu/projection/chap6figs.html". Retrieved on November 18, 2005.
- Paul Andersons' Gallery of Map Projections - PDF versions of numerous projections, created and released into the Public Domain by Paul B. Anderson ... member of the International Cartographic Association's Commission on Map Projections"]
External links
- A Cornucopia of Map Projections - A visualization of distortion on a vast array of map projections in a single image.
- G.Projector, free software by NASA GISS can render many projections.
- Map Projections. The world we live in... HyperMaths.org: Sorted list and descriptions
- RadicalCartography.net: Table of examples and properties of all common projections
- UFF.br: An interactive JAVA applet to study deformations (area, distance and angle) of map projections
- US Geological Survey overview
- USGS Map Projections: A Working Manual, freely downloadable book by USGS with details on most projections, including formulas and sample calculations.
- Map projections intro
- MathWorld's formulae
- Prognosis.com: How Projections Work
- PDFs of projections
- Mapthematics: GIFs of projections
- U.S. WWII Newsmap, "Maps are Not True for All Purposes, These are three of many projections", hosted by the UNT Libraries Digital Collections
- BTInternet: Java applet for interactive projections
- 3DSoftware: USGS info
- Geodesy, Cartography and Map Reading from Colorado State University
- MapRef: A collection of map projections and reference systems for Europe
- KartoWeb: What is a map projection?
- NewMag: The World Turned Upside Down by Katy Kramer
- PROJ.4 MapTools: Cartographic projections library
- GMT (Generic Mapping Tools), for creating maps, processing data, and learning first-hand about projections
- Understanding Map ProjectionsPDF ESRI publication.
- World Map Projections by Stephen Wolfram based on work by Yu-Sung Chang, Wolfram Demonstrations Project.
|
|||||