List of Quebec general elections
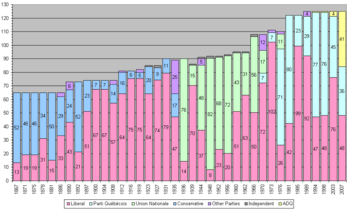
Number of seats won by major parties at each election
|
Conservative |
|
|
Liberal |
|
|
Union Nationale |
|
Parti Québécois |
|
|
Independent |
|
|
ADQ |
|
|
Other |
This article provides a summary of results for the general elections to the Canadian province of Quebec's unicameral legislative body, the National Assembly of Quebec (and its predecessor, the Legislative Assembly of Quebec). The number of seats has generally increased over time, from 65 for the first six elections, to the current high of 125.
The chart on the right shows the information graphically, with the most recent elections on the right. It shows that the Liberal party (red) is the only party to have won seats at every election; the disappearance of the Conservative party (blue) after 1935; the rise and fall of its replacement, the Union Nationale (green); and arrival of the separatist Parti Québécois (cyan) in the 1970s. The Liberal party have been the most successful in the province, winning twenty-one out of thirty-seven elections.
This article only covers elections since the Canadian confederation in 1867, when Quebec was created as one of the Canada's provinces. For Quebec's first 15 elections as Lower Canada from 1792 to 1840, see Legislative Assembly of Lower Canada. For the 8 joint elections of Ontario and Quebec as the Province of Canada, from 1840 to 1867, see list of elections in the Province of Canada.
Summary of results
The table below shows the total number of seats won by the major political parties at each election. It also shows the percentage of the vote obtained by the major political parties at each election. The winning party's totals are shown in bold. There has been five elections (1998, 1966, 1944, 1892 and 1886) in which the winning party did not have the largest share of the vote. Full details on any election are linked via the year of the election at the start of the row.
| Election |
Liberal |
Parti Québécois |
ADQ |
Union Nationale |
Conservative[A] |
Other |
Total seats |
| Vote (%) |
Seats |
Vote (%) |
Seats |
Vote (%) |
Seats |
Vote (%) |
Seats |
Vote (%) |
Seats |
Vote (%) |
Seats |
Seat-winning party |
|
|
|
|
|
|
| 2008 |
|
42.05 |
66 |
35.15 |
51 |
16.35 |
7 |
|
|
|
|
6.45 |
1 |
Québec solidaire |
125 |
| 2007 |
|
33.08 |
48 |
28.35 |
36 |
30.84 |
41 |
|
|
|
|
7.73 |
|
|
125 |
| 2003[B] |
|
45.99 |
76 |
33.24 |
45 |
18.18 |
4 |
|
|
|
|
2.59 |
|
|
125 |
| 1998[C] |
|
43.55 |
48 |
42.87 |
76 |
11.81 |
1 |
|
|
|
|
1.77 |
|
|
125 |
| 1994[D] |
|
44.40 |
47 |
44.75 |
77 |
6.46 |
1 |
|
|
|
|
4.39 |
|
|
125 |
| 1989 |
|
49.95 |
92 |
40.16 |
29 |
|
|
|
|
|
|
9.89 |
4 |
Equality |
125 |
| 1985 |
|
55.99 |
99 |
38.69 |
23 |
|
|
0.23 |
|
|
|
5.08 |
|
|
122 |
| 1981 |
|
46.08 |
42 |
49.20 |
80 |
|
|
4.00 |
|
|
|
0.71 |
|
|
122 |
| 1976 |
|
33.78 |
26 |
41.37 |
71 |
|
|
18.20 |
11 |
|
|
6.64 |
2 |
PNP, Créditistes |
110 |
| 1973 |
|
54.65 |
102 |
30.22 |
6 |
|
|
4.92 |
|
|
|
10.21 |
2 |
Créditistes |
110 |
| 1970 |
|
45.40 |
72 |
23.06 |
7 |
|
|
19.65 |
17 |
|
|
11.89 |
12 |
Créditistes |
108 |
| 1966 |
|
47.29 |
50 |
|
|
|
|
40.82 |
56 |
|
|
11.89 |
2 |
Independents |
108 |
| 1962 |
|
56.40 |
63 |
|
|
|
|
42.15 |
31 |
|
|
1.45 |
1 |
Independent |
95 |
| 1960 |
|
51.38 |
51 |
|
|
|
|
46.61 |
43 |
|
|
2.01 |
1 |
Independent |
95 |
| 1956 |
|
44.87 |
20 |
|
|
|
|
52.80 |
72 |
|
|
2.33 |
1 |
Independent |
93 |
| 1952 |
|
45.77 |
23 |
|
|
|
|
50.50 |
68 |
|
|
3.72 |
1 |
Independent |
92 |
| 1948 |
|
36.17 |
8 |
|
|
|
|
51.24 |
82 |
|
|
12.59 |
2 |
Independents |
92 |
| 1944 |
|
39.35 |
37 |
|
|
|
|
38.02 |
48 |
|
|
22.63 |
6 |
Bloc Populaire (4)
CCF, Independent |
91 |
| 1939 |
|
54.05 |
70 |
|
|
|
|
39.13 |
15 |
|
|
6.81 |
1 |
Independent |
86 |
| 1936 |
|
39.41 |
14 |
|
|
|
|
56.88 |
76 |
|
|
3.71 |
|
|
90 |
| 1935 |
|
46.53 |
47 |
|
|
|
|
|
|
18.93 |
17 |
34.54 |
25 |
ALN |
89 |
| 1931 |
|
54.88 |
79 |
|
|
|
|
|
|
43.54 |
11 |
1.58 |
|
|
90 |
| 1927 |
|
59.33 |
74 |
|
|
|
|
|
|
34.31 |
9 |
6.36 |
2 |
Independents |
85 |
| 1923 |
|
52.52 |
64 |
|
|
|
|
|
|
39.32 |
20 |
8.16 |
1 |
Independent |
85 |
| 1919 |
|
51.91 |
75 |
|
|
|
|
|
|
16.90 |
5 |
31.19 |
2 |
Parti ouvrier |
82 |
| 1916 |
|
60.57 |
75 |
|
|
|
|
|
|
35.09 |
6 |
4.34 |
|
|
81 |
| 1912 |
|
53.54 |
64[E] |
|
|
|
|
|
|
43.01 |
16 |
3.45 |
1 |
Ligue nationaliste |
81 |
| 1908 |
|
53.53 |
57 |
|
|
|
|
|
|
39.92 |
14 |
6.55 |
3 |
Ligue nationaliste |
74 |
| 1904 |
|
55.43 |
67 |
|
|
|
|
|
|
42.73 |
7 |
1.84 |
|
|
74 |
| 1900 |
|
53.15 |
67 |
|
|
|
|
|
|
41.85 |
7 |
5.00 |
|
|
74 |
| 1897 |
|
53.28 |
51 |
|
|
|
|
|
|
43.82 |
23 |
2.90 |
|
|
74 |
| 1892 |
|
43.65 |
21 |
|
|
|
|
|
|
42.41 |
52 |
13.94 |
|
|
73 |
| 1890 |
|
44.20 |
43 |
|
|
|
|
|
|
45.11 |
24 |
10.69 |
6 |
Parti national (5);
Parti ouvrier |
73 |
| 1886 |
|
39.58 |
33 |
|
|
|
|
|
|
46.19 |
29 |
14.23 |
3 |
Parti national |
65 |
| 1881 |
|
38.97 |
15 |
|
|
|
|
|
|
50.38 |
50 |
10.65 |
|
|
65 |
| 1878 |
|
47.49 |
31[H] |
|
|
|
|
|
|
49.49 |
34 |
3.02 |
|
|
65 |
| 1875 |
|
38.59 |
19 |
|
|
|
|
|
|
50.67 |
46 |
10.74 |
|
|
65 |
| 1871 |
|
39.43 |
19 |
|
|
|
|
|
|
51.72 |
46 |
8.84 |
|
|
65 |
| 1867 |
|
35.40 |
13[F] |
|
|
|
|
|
|
53.48 |
52[G] |
11.12 |
|
|
65 |
Notes
- A includes all Independent Conservative candidates elected from 1875 to 1892.
- B results include the by-election held on 20 May 2003 in the Champlain electoral district to break a tie in the original general election.
- C results include the by-election held on 14 December 1998 in the Masson electoral district due to the death of PQ candidate Yves Blais on 22 November 1998.
- D results include the by-election held on 24 October 1994 in the Saint-Jean electoral district to break a tie in the original general election.
- E includes Independent Liberal candidate; the 27 May 1912 election of Gustave Lemieux by acclamation in Gaspé; and the 15 July 1912 election of Joseph-Édouard Caron in the Îles-de-la-Madeleine.
- F includes the Independent Liberal candidate elected.
- G includes the Conservative candidate elected in the by-election held in Kamouraska on 11 February 1869.
- H Power went back and forth a few times after the 1878 election. For most of that legislature, the Liberals controlled a minority parliament with the support of some Conservative members.
References
|
Politics of Quebec |
|
| Lieutenant-Governor |
Pierre Duchesne • Former lieutenant-governors
|
 |
|
| Premier |
Jean Charest • Former premiers • Cabinet • Government departments
|
|
| Opposition Leader |
Pauline Marois • Former Opposition Leaders
|
|
| Speaker of the Assembly |
Michel Bissonnet
|
|
| Legislature |
|
|
| Political parties |
|
|
| Elections |
Quebec general election, 2003 • Quebec general election, 2007 • Quebec general election, 2008 • Electoral districts • Referendums on independence (1995 • 1980)
|
|
| Current issues |
|
|
| Other Canadian politics |
Federal • BC • AB • SK • MB • ON • QC • NB • NS • PEI • NL • YU • NT • NU
|
|
|
Elections in Canada |
|
| Most recent |
Federal 2008 • British Columbia 2005 • Alberta 2008 • Saskatchewan 2007 • Manitoba 2007 • Ontario 2007 • Quebec 2008 • New Brunswick 2006 • Nova Scotia 2006 • Prince Edward Island 2007 • Newfoundland and Labrador 2007 • Yukon 2006 • Northwest Territories 2007 • Nunavut 2008 • Provincial summary
|
|
| Lists |
Amalgamated timeline • Federal (By-elections) • BC • AB • SK • MB • ON • QC • NB • PEI • NS • NL • YU • NT • NU
|
|
| Electoral districts |
• AB • • • • QC • • • • • • •
|
|
|
Quebec general elections |
|
|
1867 · 1871 · 1875 · 1878 · 1881 · 1886 · 1890 · 1892 · 1897 · 1900 · 1904 · 1908 · 1912 · 1916 · 1919 · 1923 · 1927 · 1931 · 1935 · 1936 · 1939 · 1944 · 1948 · 1952 · 1956 · 1960 · 1962 · 1966 · 1970 · 1973 · 1976 · 1981 · 1985 · 1989 · 1994 · 1998 · 2003 · 2007 · 2008
|
|
Quebec referendums
|
|
|
1980 · 1995
|
|