Greenhouse gas

Greenhouse gases are gaseous constituents of the atmosphere, both natural and anthropogenic, that absorb and emit radiation at specific wavelengths within the spectrum of thermal infrared radiation emitted by the Earth’s surface, the atmosphere itself, and by clouds. This property causes the greenhouse effect.[1] Greenhouse gases are essential to maintaining the temperature of the Earth; without them the planet would be so cold as to be uninhabitable.[2][3] Natural sources are the Earth's ecosystem, and anthropogenic sources include industrial, transportation, residential, commercial and agricultural processes. [4] Venus, Mars and Titan also have atmospheric gases that cause greenhouse effects.
Contents |
The greenhouse effect
In order, Earth's most abundant greenhouse gases are:
By effect, the most important greenhouse gases are:[5][6]
- water vapor, which causes about 36–70% of the greenhouse effect on Earth. (Note clouds typically affect climate differently from other forms of atmospheric water.)
- carbon dioxide, which causes 9–26%
- methane, which causes 4–9%
- ozone, which causes 3–7%
Importance is a combination of the strength of the greenhouse effect of the gas and its abundance. For example, methane is a much stronger greenhouse gas than carbon dioxide, but is present in much smaller concentrations.
It is not possible to state that a certain gas causes a certain percentage of the greenhouse effect, because the influences of the various gases are not additive. (The higher ends of the ranges quoted are for the gas alone; the lower ends, for the gas counting overlaps.)[7][8] Other greenhouse gases include, but are not limited to, nitrous oxide, sulfur hexafluoride, hydrofluorocarbons, perfluorocarbons and chlorofluorocarbons (see IPCC list of greenhouse gases). Some greenhouse gases are present but not often listed. For example, nitrogen trifluoride has a high global warming potential (GWP) but is only present in small quantities.[9]
The major atmospheric constituents (nitrogen, N2 and oxygen, O2) are not greenhouse gases. Nor is the approximately 1% of argon, Ar. This is because homonuclear diatomic molecules such as N2 and O2 and monatomic molecules such as Ar neither absorb nor emit infrared radiation, as there is no net change in the dipole moment of these molecules when they vibrate. Molecular vibrations occur at energies that are of the same magnitude as the energy of the photons on infrared light. Heteronuclear diatomics such as CO or HCl absorb IR; however, these molecules are short-lived in the atmosphere owing to their reactivity and solubility. As a consequence they do not contribute significantly to the greenhouse effect.
Late 19th century scientists experimentally discovered that N2 and O2 did not absorb infrared radiation (called, at that time, "dark radiation") and that CO2 and many other gases did absorb such radiation. It was recognized in the early 20th century that the greenhouse gases in the atmosphere caused the Earth's overall temperature to be higher than it would be without them.
Natural and anthropogenic

Aside from purely human-produced synthetic halocarbons, most greenhouse gases now have both natural and anthropogenic sources. During the pre-industrial holocene, concentrations of existing gases were roughly constant. In the industrial era, human activities have added greenhouse gases to the atmosphere, mainly through the burning of fossil fuels and clearing of forests.[10]
| Gas | Preindustrial Level | Current Level | Increase since 1750 | Radiative forcing (W/m2) |
|---|---|---|---|---|
| Carbon dioxide | 280 ppm | 387ppm | 104 ppm | 1.46 |
| Methane | 700 ppb | 1,745 ppb | 1,045 ppb | 0.48 |
| Nitrous oxide | 270 ppb | 314 ppb | 44 ppb | 0.15 |
| CFC-12 | 0 | 533 ppt | 533 ppt | 0.17 |
Ice cores provide evidence for variation in greenhouse gas concentrations over the past 800,000 years. Both CO2 and CH4 vary between glacial and interglacial phases, and concentrations of these gases correlate strongly with temperature. Before the ice core record, direct measurements do not exist. Various proxies and modelling suggests large variations; 500 Myr ago CO2 levels were likely 10 times higher than now.[11] Indeed higher CO2 concentrations are thought to have prevailed throughout most of the Phanerozoic eon, with concentrations four to six times current concentrations during the Mesozoic era, and ten to fifteen times current concentrations during the early Palaeozoic era until the middle of the Devonian period, about 400 Mya.[12][13][14] The spread of land plants is thought to have reduced CO2 concentrations during the late Devonian, and plant activities as both sources and sinks of CO2 have since been important in providing stabilising feedbacks.[15] Earlier still, a 200-million year period of intermittent, widespread glaciation extending close to the equator (Snowball Earth) appears to have been ended suddenly, about 550 Mya, by a colossal volcanic outgassing which raised the CO2 concentration of the atmosphere abruptly to 12%, about 350 times modern levels, causing extreme greenhouse conditions and carbonate deposition as limestone at the rate of about 1mm per day.[16] This episode marked the close of the Precambrian eon, and was succeeded by the generally warmer conditions of the Phanerozoic, during which multicellular animal and plant life evolved. No volcanic carbon dioxide emission of comparable scale has occurred since. In the modern era, emissions to the atmosphere from volcanoes are only about 1% of emissions from human sources.[16][17]
Anthropogenic greenhouse gases

Since about 1750 human activity has increased the concentration of carbon dioxide and of some other greenhouse gases.[18] Natural sources of carbon dioxide are more than 20 times greater than sources due to human activity,[19] but over periods longer than a few years natural sources are closely balanced by natural sinks such as weathering of continental rocks and photosynthesis of carbon compounds by plants and marine plankton. As a result of this balance, the atmospheric concentration of carbon dioxide remained between 260 and 280 parts per million for the 10,000 years between the end of the last glacial maximum and the start of the industrial era.[20]
Some of the main sources of greenhouse gases due to human activity include:
- burning of fossil fuels and deforestation leading to higher carbon dioxide concentrations. Land use change (mainly deforestation in the tropics) account for up to one third of total anthropogenic CO2 emissions.[20]
- livestock enteric fermentation and manure management,[21] paddy rice farming, land use and wetland changes, pipeline losses, and covered vented landfill emissions leading to higher methane atmospheric concentrations. Many of the newer style fully vented septic systems that enhance and target the fermentation process also are sources of atmospheric methane.
- use of chlorofluorocarbons (CFCs) in refrigeration systems, and use of CFCs and halons in fire suppression systems and manufacturing processes.
- agricultural activities, including the use of fertilizers, that lead to higher nitrous oxide concentrations.
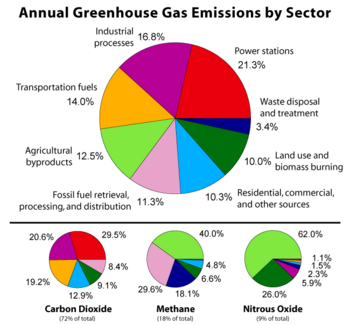
The seven sources of CO2 from fossil fuel combustion are (with percentage contributions for 2000–2004):[22]
- Solid fuels (e.g. coal): 35%
- Liquid fuels (e.g. gasoline): 36%
- Gaseous fuels (e.g. natural gas): 20%
- Flaring gas industrially and at wells: <1%
- Cement production: 3%
- Non-fuel hydrocarbons: <1%
- The "international bunkers" of shipping and air transport not included in national inventories: 4%
The U.S. EPA ranks the major greenhouse gas contributing end-user sectors in the following order: industrial, transportation, residential, commercial and agricultural[23]. Major sources of an individual's GHG include home heating and cooling, electricity consumption, and transportation. Corresponding conservation measures are improving home building insulation, compact fluorescent lamps and choosing energy-efficient vehicles.
Carbon dioxide, methane, nitrous oxide and three groups of fluorinated gases (sulfur hexafluoride, HFCs, and PFCs) are the major greenhouse gases and the subject of the Kyoto Protocol, which came into force in 2005.[24]
Although CFCs are greenhouse gases, they are regulated by the Montreal Protocol, which was motivated by CFCs' contribution to ozone depletion rather than by their contribution to global warming. Note that ozone depletion has only a minor role in greenhouse warming though the two processes often are confused in the media.
Role of water vapor

Water vapor is a naturally occurring greenhouse gas and accounts for the largest percentage of the greenhouse effect, between 36% and 66%.[25] Water vapor concentrations fluctuate regionally, but human activity does not directly affect water vapor concentrations except at local scales (for example, near irrigated fields).
The Clausius-Clapeyron relation establishes that warmer air can hold more water vapor per unit volume. Current state-of-the-art climate models predict that increasing water vapor concentrations in warmer air will amplify the greenhouse effect created by anthropogenic greenhouse gases while maintaining nearly constant relative humidity. Thus water vapor acts as a positive feedback to the forcing provided by greenhouse gases such as CO2.[26]
Greenhouse gas emissions
Measurements from Antarctic ice cores show that just before industrial emissions started, atmospheric CO2 levels were about 280 parts per million by volume (ppm; the units µL/L are occasionally used and are identical to parts per million by volume). From the same ice cores it appears that CO2 concentrations stayed between 260 and 280 ppm during the preceding 10,000 years. However, because of the way air is trapped in ice and the time period represented in each ice sample analyzed, these figures are long term averages not annual levels. Studies using evidence from stomata of fossilized leaves suggest greater variability, with CO2 levels above 300 ppm during the period 7,000–10,000 years ago,[27] though others have argued that these findings more likely reflect calibration/contamination problems rather than actual CO2 variability.[28][29]
Since the beginning of the Industrial Revolution, the concentrations of many of the greenhouse gases have increased. The concentration of CO2 has increased by about 100 ppm (i.e., from 280 ppm to 380 ppm). The first 50 ppm increase took place in about 200 years, from the start of the Industrial Revolution to around 1973; the next 50 ppm increase took place in about 33 years, from 1973 to 2006.[30]. Many observations are available online in a variety of Atmospheric Chemistry Observational Databases. The greenhouse gases with the largest radiative forcing are:
| Gas | Current (1998) Amount by volume | Increase over pre-industrial (1750) | Percentage increase | Radiative forcing (W/m²) |
|---|---|---|---|---|
| Carbon dioxide |
|
|
|
|
| Methane |
|
|
|
|
| Nitrous oxide |
|
|
|
|

| Gas | Current (1998) Amount by volume |
Radiative forcing (W/m²) |
|---|---|---|
| CFC-11 |
|
|
| CFC-12 |
|
|
| CFC-113 |
|
|
| Carbon tetrachloride |
|
|
| HCFC-22 |
|
|
(Source: IPCC radiative forcing report 1994 updated (to 1998) by IPCC TAR table 6.1 [7] [8]).
Recent rates of change and emission

The sharp acceleration in CO2 emissions since 2000 of >3% y−1 (>2 ppm y−1) from 1.1% y−1 during the 1990s is attributable to the lapse of formerly declining trends in carbon intensity of both developing and developed nations. Although over 3/4 of cumulative anthropogenic CO2 is still attributable to the developed world, China was responsible for most of global growth in emissions during this period. Localised plummeting emissions associated with the collapse of the Soviet Union have been followed by slow emissions growth in this region due to more efficient energy use, made necessary by the increasing proportion of it that is exported.[22] In comparison, methane has not increased appreciably, and N2O by 0.25% y−1.[31]
The direct emissions from industry have declined due to a constant improvement in energy efficiency, but also to a high penetration of electricity. If one includes indirect emissions, related to the production of electricity, CO2 emissions from industry in Europe are roughly stabilized since 1994. [32]
Asia
Atmospheric levels of CO2 have set another new peak, partly a sign of the industrial rise of Asian economies led by China.[33] Over the 2000-2010 interval China is expected to increase its carbon dioxide emissions by 600 Mt, largely because of the rapid construction of old-fashioned power plants in poorer internal provinces.[34]
United States
The United States emitted 16.3% more GHG in 2005 than it did in 1990.[35] According to a preliminary estimate by the Netherlands Environmental Assessment Agency, the largest national producer of CO2 emissions since 2006 has been China with an estimated annual production of about 6200 megatonnes. China is followed by the United States with about 5,800 megatonnes. However the per capita emission figures of China are still about one quarter of those of the US population.

Relative to 2005, China's fossil CO2 emissions increased in 2006 by 8.7%, while in the USA, comparable CO2 emissions decreased in 2006 by 1.4%. The agency notes that its estimates do not include some CO2 sources of uncertain magnitude.[36] These figures rely on national CO2 data that do not include aviation. Although these tonnages are small compared to the CO2 in the Earth's atmosphere, they are significantly larger than pre-industrial levels.
- See also: Climate change in the United States
Long-term trend

Atmospheric carbon dioxide concentration is increasing at an increasing rate. In the 1960s, the average annual increase was only 37% of what it was in 2000 through 2007.[37] People with asthma and even active healthy adults, such as construction workers, can experience a reduction in lung function and an increase in respiratory symptoms (chest pain and coughing) when exposed to low levels of ozone during periods of moderate exertion. [38]
Removal from the atmosphere and global warming potential
Aside from water vapor, which has a residence time of days, most greenhouse gases take many years to leave the atmosphere. Although it is not easy to know with precision how long it takes greenhouse gases to leave the atmosphere, there are estimates for the principal greenhouse gases.
Greenhouse gases can be removed from the atmosphere by various processes:
- as a consequence of a physical change (condensation and precipitation remove water vapor from the atmosphere).
- as a consequence of chemical reactions within the atmosphere. This is the case for methane. It is oxidized by reaction with naturally occurring hydroxyl radical, OH· and degraded to CO2 and water vapor at the end of a chain of reactions (the contribution of the CO2 from the oxidation of methane is not included in the methane Global warming potential). This also includes solution and solid phase chemistry occurring in atmospheric aerosols.
- as a consequence of a physical interchange at the interface between the atmosphere and the other compartments of the planet. An example is the mixing of atmospheric gases into the oceans at the boundary layer.
- as a consequence of a chemical change at the interface between the atmosphere and the other compartments of the planet. This is the case for CO2, which is reduced by photosynthesis of plants, and which, after dissolving in the oceans, reacts to form carbonic acid and bicarbonate and carbonate ions (see ocean acidification).
- as a consequence of a photochemical change. Halocarbons are dissociated by UV light releasing Cl· and F· as free radicals in the stratosphere with harmful effects on ozone (halocarbons are generally too stable to disappear by chemical reaction in the atmosphere).
- as a consequence of dissociative ionization caused by high energy cosmic rays or lightning discharges, which break molecular bonds. For example, lightning forms N anions from N2 which then react with O2 to form NO2.

Atmospheric lifetime
Jacob (1999)[39] defines the lifetime  of an atmospheric species X in a one-box model as the average time that a molecule of X remains in the box. Mathematically can be defined as the ratio of the mass
  (in kg) of X in the box to its removal rate, which is the sum of the flow of X out of the box (
 ), chemical loss of X (
 ), and deposition of X (
 ) (all in kg/sec):
 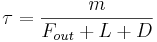 [39]
[39]
The atmospheric lifetime of a species therefore measures the time required to restore equilibrium following an increase in its concentration in the atmosphere. Individual atoms or molecules may be lost or deposited to sinks such as the soil, the oceans and other waters, or vegetation and other biological systems, reducing the excess to background concentrations. The average time taken to achieve this is the mean lifetime. The atmospheric lifetime of CO2 is often incorrectly stated to be only a few years because that is the average time for any CO2 molecule to stay in the atmosphere before being removed by mixing into the ocean, photosynthesis, or other processes. However, this ignores the balancing fluxes of CO2 into the atmosphere from the other reservoirs. It is the net concentration changes of the various greenhouse gases by all sources and sinks that determines atmospheric lifetime, not just the removal processes.
Global warming potential
The global warming potential (GWP) depends on both the efficiency of the molecule as a greenhouse gas and its atmospheric lifetime. GWP is measured relative to the same mass of CO2 and evaluated for a specific timescale. Thus, if a molecule has a high GWP on a short time scale (say 20 years) but has only a short lifetime, it will have a large GWP on a 20 year scale but a small one on a 100 year scale. Conversely, if a molecule has a longer atmospheric lifetime than CO2 its GWP will increase with time.
Examples of the atmospheric lifetime and GWP for several greenhouse gases include:
- CO2 has a variable atmospheric lifetime, and cannot be specified precisely.[40] Recent work indicates that recovery from a large input of atmospheric CO2 from burning fossil fuels will result in an effective lifetime of tens of thousands of years.[41][42] Carbon dioxide is defined to have a GWP of 1 over all time periods.
- Methane has an atmospheric lifetime of 12 ± 3 years and a GWP of 62 over 20 years, 23 over 100 years and 7 over 500 years. The decrease in GWP at longer times is because methane is degraded to water and CO2 by chemical reactions in the atmosphere.
- Nitrous oxide has an atmospheric lifetime of 120 years and a GWP of 296 over 100 years.
- CFC-12 has an atmospheric lifetime of 100 years and a GWP of 10600 over 100 years.
- HCFC-22 has an atmospheric lifetime of 12.1 years and a GWP of 1700 over 100 years.
- Tetrafluoromethane has an atmospheric lifetime of 50,000 years and a GWP of 5700 over 100 years.
- Sulfur hexafluoride has an atmospheric lifetime of 3,200 years and a GWP of 22000 over 100 years.
The use of CFC-12 (except some essential uses) has been phased out due to its ozone depleting properties[43]. The phasing-out of less active HCFC-compounds will be completed in 2030[44].
Airborne fraction
Airborne fraction (AF) is the proportion of a emission (e.g. CO2) remaining in the atmosphere after a specified time. Canadell (2007)[45] define the annual AF as the ratio of the atmospheric CO2 increase in a given year to that year’s total emissions, and calculate that of the average 9.1 PgC y-1 of total anthropogenic emissions from 2000 to 2006, the AF was 0.45. For CO2 the AF over the last 50 years (1956-2006) has been increasing at 0.25±0.21%/year.[45]
Related effects

Carbon monoxide has an indirect radiative effect by elevating concentrations of methane and tropospheric ozone through scavenging of atmospheric constituents (e.g., the hydroxyl radical, OH) that would otherwise destroy them. Carbon monoxide is created when carbon-containing fuels are burned incompletely. Through natural processes in the atmosphere, it is eventually oxidized to carbon dioxide. Carbon monoxide has an atmospheric lifetime of only a few months[46] and as a consequence is spatially more variable than longer-lived gases.
Another potentially important indirect effect comes from methane, which in addition to its direct radiative impact also contributes to ozone formation. Shindell et al (2005)[47] argue that the contribution to climate change from methane is at least double previous estimates as a result of this effect.[48]
See also
- Atmospheric Chemistry Observational Databases for links to freely available data.
- Atmospheric window
- Attribution of recent climate change
- Biochar
- List of countries by electricity production from renewable source
- Carbon emissions by country
- Carbon dioxide sink
- Carbon Disclosure Project
- Carbon emissions reporting
- Carbon neutral
- Carbon Dioxide Information Analysis Center
- Clean Air Act
- Climate Group
- Earth's atmosphere
- Emission standard
- Environmental accounting
- Environmental agreements
- European Climate Change Programme
- External cost
- Global warming
- Greenhouse debt
- Greenhouse effect
- Greenhouse gas emissions from transportation
- Greenhouse gas emissions in the USA
- Global Atmosphere Watch
- Hydrogen economy
- List of countries by greenhouse gas emissions per capita
- Massachusetts v. Environmental Protection Agency
- North American Carbon Program
- Norwegian Polar Institute
- Ocean acidification
- Radiative forcing
- Regional Greenhouse Gas Initiative
- United Nations Intergovernmental Panel on Climate Change
- Virgin Earth Challenge
- Western Regional Climate Action Initiative
- World energy resources and consumption
- Zero carbon economy
External links
- Greenhouse gas at the Open Directory Project
- The NOAA Annual Greenhouse Gas Index (AGGI)
- Greenhouse Gases Sources, Levels, Study results — University of Michigan; eia.doe.gov findings
- How Much Greenhouse Gas Does the United States Emit?
- Greenhouse-gas reduction technologies for coal-fired power generation.
- Carbon dioxide emissions
- World's Most Accurate Carbon Emissions Calculator
- International Energy Annual: Reserves
- International Energy Annual 2003: Carbon Dioxide Emissions
- International Energy Annual 2003: Notes and Sources for Table H.1co2 (Metric tons of carbon dioxide can be converted to metric tons of carbon equivalent by multiplying by 12/44)
- DOE — EIA — Alternatives to Traditional Transportation Fuels 1994 — Volume 2, Greenhouse Gas Emissions (includes "Greenhouse Gas Spectral Overlaps and Their Significance")
- NOAA Paleoclimatology Program — Vostok Ice Core
- NOAA CMDL CCGG — Interactive Atmospheric Data Visualization NOAA CO2 data
- Carbon Dioxide Information Analysis Centre FAQ Includes links to Carbon Dioxide statistics
- Little Green Data Book 2007, World Bank. Lists C02 statistics by country, including per capita and by country income class.
- Flight Carbon Emission Calculator
- Database of carbon emissions of power plants
- NASA's Orbiting Carbon Observatory
- Methane emissions
- BBC News — Thawing Siberian bogs are releasing more methane
- METHANE-EATING BUG HOLDS PROMISE FOR CUTTING GREENHOUSE GAS. Media Release, GNS Science, New Zealand
- Policy and advocacy
- Australian Greenhouse Gas Initiative
- Global Green Plan, a not-for profit organisation based in Melbourne, Australia, developing school curriculum to teach youth how to reduce emissions
- Carbon Dioxide is Good for the Environment 2001 paper by the National Center for Public Policy Research
- Environmental Effects of Increased Atmospheric Carbon Dioxide paper by the Oregon Institute of Science and Medicine
- EU page about reducing CO2 emissions from light-duty vehicles : the EU's aim is to reach — by 2010 at the latest — an average CO2 emission figure of 120 g/km for all new passenger cars marketed in the Union.
References
- ↑ [1] IPCC AR4 SYR Appendix Glossary
- ↑ Karl, Thomas R.; Kevin E. Trenberth (2003). "Modern Global Climate Change". Science 302 (5651): 1719–1723. doi:. http://www.sciencemag.org/cgi/content/abstract/302/5651/1719.
- ↑ Le Treut, H., R. Somerville, U. Cubasch, Y. Ding, C. Mauritzen, A. Mokssit, T. Peterson and M. Prather, 2007: Historical Overview of Climate Change Science In: Climate Change 2007: The Physical Science Basis. Contribution of Working Group I to the Fourth Assessment Report of the Intergovernmental Panel on Climate Change [Solomon, S., D. Qin, M. Manning, Z. Chen, M. Marquis, K.B. Averyt, M. Tignor and H.L. Miller (eds.)]. Cambridge University Press, Cambridge, United Kingdom and New York, NY, USA
- ↑ http://www.grida.no/Climate/ipcc/emission/049.htm Chapter 3, IPCC Special Report on Emissions Scenarios, 2000
- ↑ Kiehl, J. T.; Kevin E. Trenberth (February 1997). "Earth’s Annual Global Mean Energy Budget" (PDF). Bulletin of the American Meteorological Society 78 (2): 197–208. doi:. http://www.atmo.arizona.edu/students/courselinks/spring04/atmo451b/pdf/RadiationBudget.pdf. Retrieved on 2006-05-01.
- ↑ "Water vapour: feedback or forcing?". RealClimate (6 April 2005). Retrieved on 2006-05-01.
- ↑ Prather, Michael J.; J Hsu (2008-06-26). "NF3, the greenhouse gas missing from Kyoto". Geophysical Research Letters (American Geophysical Union) 35 (L12810). doi:. http://www.agu.org/pubs/crossref/2008/2008GL034542.shtml.
- ↑ "Chapter 1 Historical Overview of Climate Change Science" (PDF). Climate Change 2007: The Physical Science Basis. Contribution of Working Group I to the Fourth Assessment Report of the Intergovernmental Panel on Climate Change. Intergovernmental Panel on Climate Change (2007-02-05). Retrieved on 2008-04-25.
- ↑ Image:Phanerozoic Carbon Dioxide.png
- ↑ Berner, Robert A. (1994). "GEOCARB II: a revised model of atmospheric CO2 over Phanerozoic time". American Journal of Science 294: 56–91. ISSN 0002-9599. http://earth.geology.yale.edu/~ajs/1994/01.1994.02Berner.pdf.
- ↑ Royer, DL; RA Berner and DJ Beerling (2001). "Phanerozoic atmospheric CO2 change: evaluating geochemical and paleobiological approaches". Earth-Science Reviews 54: 349–392.
- ↑ Berner, Robert A.; Kothavala, Zavareth (2001). "GEOCARB III: a revised model of atmospheric CO2 over Phanerozoic time". American Journal of Science 301 (2): 182–204. ISSN 0002-9599. http://www.geology.yale.edu/~ajs/2001/Feb/qn020100182.pdf.
- ↑ Beerling, DJ; Berner, RA (2005). "Feedbacks and the co-evolution of plants and atmospheric CO2". Proceedings of the National Academy of Science 102: 1302–1305.
- ↑ 16.0 16.1 Hoffmann, PF; AJ Kaufman, GP Halverson, DP Schrag (1998). "A neoproterozoic snowball earth". Science 281: 1342–1346. http://www.sciencemag.org/cgi/content/full/281/5381/1342?ijkey=48d78da67bab492803c333f50c0dd84fbbef109c.
- ↑ Gerlach, TM (1991). "Present-day CO2 emissions from volcanoes". Transactions of the American Geophysical Union 72: 249–255. ISSN 0096-3941.
- ↑ "Climate Change 2001: Working Group I: The Scientific Basis: figure 6-6". Retrieved on 2006-05-01.
- ↑ The present carbon cycle - Climate Change
- ↑ 20.0 20.1 IPCC; Solomon, S., D. Qin, M. Manning, Z. Chen, M. Marquis, K.B. Averyt, M. Tignor and H.L. Miller (eds.) (2007). "Chapter 7. Couplings Between Changes in the Climate System and Biogeochemistry". Climate Change 2007: The Physical Science Basis. Contribution of Working Group I to the Fourth Assessment Report of the Intergovernmental Panel on Climate Change. Cambridge, United Kingdom and New York, NY, USA: Cambridge University Press. ISBN 978-0-521-88009-1.
- ↑ H. Steinfeld, P. Gerber, T. Wassenaar, V. Castel, M. Rosales, C. de Haan (2006) Livestock’s long shadow. Environmental issues and options. FAO Livestock, Environment and Development (LEAD) Initiative. [2]
- ↑ 22.0 22.1 Raupach, M.R. et al. (2007) "Global and regional drivers of accelerating CO2 emissions." Proc. Nat. Acad. Sci. 104(24): 10288–10293.
- ↑ U.S. Greenhouse Gas Inventory - U.S. Greenhouse Gas Inventory Reports | Climate Change - Greenhouse Gas Emissions | U.S. EPA
- ↑ Lerner & K. Lee Lerner, Brenda Wilmoth (2006). "Environmental issues: essential primary sources."". Thomson Gale. Retrieved on 2006-09-11.
- ↑ realclimate.org. Water vapour: feedback or forcing?.
- ↑ Held, Isaac M.; Soden, Brian J. (2006), "Robust Responses of the Hydrological Cycle to Global Warming", Journal of Climate 19 (21): 5686–5699, doi:, http://www.gfdl.noaa.gov/reference/bibliography/2006/ih0601.pdf, retrieved on 2007-07-11
- ↑ Friederike Wagner, Bent Aaby and Henk Visscher (2002). "Rapid atmospheric CO2 changes associated with the 8,200-years-B.P. cooling event". PNAS 99 (19): 12011–12014. doi:. PMID 12202744.
- ↑ Andreas Indermühle, Bernhard Stauffer, Thomas F. Stocker (1999). "Early Holocene Atmospheric CO2 Concentrations". Science 286 (5446): 1815. doi:. "Early Holocene Atmospheric CO2 Concentrations". Science. Retrieved on 2005-05-26.
- ↑ H.J. Smith, M Wahlen and D. Mastroianni (1997). "The CO2 concentration of air trapped in GISP2 ice from the Last Glacial Maximum-Holocene transition". Geophysical Research Letters 24 (1): 1–4. doi:.
- ↑ [3]PDF (96.8 KiB)
- ↑ [4]
- ↑ Climate change policies : Analysis of sectoral changes in Europe, C. Barbier, R. Baron, M. Colombier, C. Boemare, Idées pour le débat, n° 24, 2004, Institute for Sustainable Development and International Relations. [5]
- ↑ Planet Ark: Greenhouse Gases at New Peak in Sign of Asia Growth
- ↑ "UC Analysis Shows Alarming Increase in Expected Growth of China's Carbon Dioxide Emissions" accessed 2008-03-11
- ↑ Emissions inventory from the EPA, cited in Science News, vol. 171, p. 318
- ↑ ""China now no. 1 in CO2 emissions; USA in second position"" (2007). Retrieved on 2007-06-21.
- ↑ Dr. Pieter Tans (3 May 2008) "Annual CO2 mole fraction increase (ppm)" for 1959-2007 National Oceanic and Atmospheric Administration Earth System Research Laboratory, Global Monitoring Division (additional details; see also K.A. Masarie, P.P. Tans (1995) "Extension and integration of atmospheric carbon dioxide data into a globally consistent measurement record," J. Geopys. Research, vol. 100, 11593-11610.)
- ↑ http://www.epa.gov/air/caa/peg/cleanup.html
- ↑ 39.0 39.1 Jacob, Daniel (1999). Introduction to Atmospheric Chemistry. Princeton University Press. pp. 25–26. ISBN 0-691-00185-5. http://www-as.harvard.edu/people/faculty/djj/book/.
- ↑ Solomon, Susan; Qin, Dahe; Manning, Martin et al., eds. (2007), "Frequently Asked Question 7.1 "Are the Increases in Atmospheric Carbon Dioxide and Other Greenhouse Gases During the Industrial Era Caused by Human Activities?"", IPCC, 2007: Climate Change 2007: The Physical Science Basis. Contribution of Working Group I to the Fourth Assessment Report of the Intergovernmental Panel on Climate Change, Cambridge, United Kingdom and New York, NY, USA: Cambridge Press, ISBN 978-0521-88009-1, http://www.gcrio.org/ipcc/ar4/wg1/faq/ar4wg1faq-7-1.pdf, retrieved on 2007-07-24
- ↑ Archer, David (2005), "Fate of fossil fuel CO2 in geologic time", Journal of Geophysical Research 110 (C9): C09S05.1–C09S05.6, doi:, http://geosci.uchicago.edu/~archer/reprints/archer.2005.fate_co2.pdf, retrieved on 2007-07-27
- ↑ Caldeira, Ken; Wickett, Michael E. (2005), "Ocean model predictions of chemistry changes from carbon dioxide emissions to the atmosphere and ocean", Journal of Geophysical Research 110 (C9): C09S04.1–C09S04.12, doi:, http://www.ipsl.jussieu.fr/~jomce/acidification/paper/Caldeira_Wickett_2005_JGR.pdf, retrieved on 2007-07-27
- ↑ Use of ozone depleting substances in laboratories. TemaNord 2003:516. http://www.norden.org/pub/ebook/2003-516.pdf.
- ↑ Montreal Protocol
- ↑ 45.0 45.1 Canadell, J.G.; Le Quere, C.; Raupach, M.R.; Field, C.B.; Buitenhuis, E.T.; Ciais, P.; Conway, T.J.; Gillett, N.P.; Houghton, R.A.; Marland, G. (2007). "Contributions to accelerating atmospheric CO2 growth from economic activity, carbon intensity, and efficiency of natural sinks". Proceedings of the National Academy of Sciences: 0702737104v1. http://www.pnas.org/cgi/reprint/0702737104v1.pdf. Retrieved on 2008-03-15.
- ↑ Impact of Emissions, Chemistry, and Climate on Atmospheric Carbon Monoxide: 100-year Predictions from a Global Chemistry-Climate ModelPDF (115 KiB)
- ↑ Shindell, Drew T.; Faluvegi, Greg; Bell, Nadine; Schmidt, Gavin A. "An emissions-based view of climate forcing by methane and tropospheric ozone", Geophysical Research Letters, Vol. 32, No. 4 [6]
- ↑ Methane's Impacts on Climate Change May Be Twice Previous Estimates
|
||||||||||||||||||||||||||||||||||||||||||||||||||||||||||||||||||||||||||||||||||||||||||