Gross domestic product


The gross domestic product (GDP) or gross domestic income (GDI) is one of the measures of national income and output for a given country's economy. GDP is defined as the total market value of all final goods and services produced within the country in a given period of time (usually a calendar year). It is also considered the sum of a value added at every stage of production (the intermediate stages) of all final goods and services produced within a country in a given period of time, and it is given a money value.
The most common approach to measuring and understanding GDP is the expenditure method:
- GDP = consumption + gross investment + government spending + (exports − imports), or,
GDP = C + I + G + (X-M).
"Gross" means depreciation of capital stock is not subtracted. If net investment (which is gross investment minus depreciation) is substituted for gross investment in the equation above, then the formula for net domestic product is obtained. Consumption and investment in this equation are expenditure on final goods and services. The exports-minus-imports part of the equation (often called net exports) adjusts this by subtracting the part of this expenditure not produced domestically (the imports), and adding back in domestic area (the exports).
Economists (since Keynes) have preferred to split the general consumption term into two parts; private consumption, and public sector (or government) spending. Two advantages of dividing total consumption this way in theoretical macroeconomics are:
- Private consumption is a central concern of welfare economics. The private investment and trade portions of the economy are ultimately directed (in mainstream economic models) to increases in long-term private consumption.
- If separated from endogenous private consumption, government consumption can be treated as exogenous, so that different government spending levels can be considered within a meaningful macroeconomic framework.
Contents |
GDP vs GNP
GDP can be contrasted with gross national product (GNP, or gross national income, GNI), which the United States used in its national accounts until 1992. The difference is that GNP includes net foreign income (the current account) rather than net exports and imports (the balance of trade). Put simply, GNP adds net foreign investment income compared to GDP. United States GDP, GNP and GNI (Gross National Income) can be compared at EconStats [1].
GDP is concerned with the region in which income is generated. It is the market value of all the output produced in a nation in one year. GDP focuses on where the output is produced rather than who produced it. GDP measures all domestic production, disregarding the producing entities' nationalities.
In contrast, GNP is a measure of the value of the output produced by the "nationals" of a region. GNP focuses on who owns the production. For example, in the United States, GNP measures the value of output produced by American firms, regardless of where the firms are located. Year-over-year real GNP growth in the year 2007 was 3.2%.
Measuring GDP
The components of GDP
Each of the variables C (Consumption), I (Investment), G (Government spending) and X-M (Net Exports) (where GDP = C + I + G + (X-M) as above)
(Note: * GDP is sometimes also referred to as Y in reference to a GDP graph)
- C (Consumption) is private consumption in the economy. This includes most personal expenditures of households such as food, rent, medical expenses and so on but does not include new housing.
- I (Investment) is defined as investments by business or households in capital. Examples of investment by a business include construction of a new mine, purchase of software, or purchase of machinery and equipment for a factory. Spending by households (not government) on new houses is also included in Investment. In contrast to its colloquial meaning, 'Investment' in GDP does not mean purchases of financial products. Buying financial products is classed as 'saving', as opposed to investment. The distinction is (in theory) clear: if money is converted into goods or services, it is investment; but, if you buy a bond or a share of stock, this transfer payment is excluded from the GDP sum. That is because the stocks and bonds affect the financial capital which in turn affects the production and sales which in turn affects the investments. So stocks and bonds indirectly affect the GDP. Although such purchases would be called investments in normal speech, from the total-economy point of view, this is simply swapping of deeds, and not part of real production or the GDP formula.
- G (Government spending) is the sum of government expenditures on final goods and services. It includes salaries of public servants, purchase of weapons for the military, and any investment expenditure by a government. It does not include any transfer payments, such as social security or unemployment benefits.
- X (Exports) is gross exports. GDP captures the amount a country produces, including goods and services produced for other nations' consumption, therefore exports are added.
- M (Imports) is gross imports. Imports are subtracted since imported goods will be included in the terms G, I, or C, and must be deducted to avoid counting foreign supply as domestic.
Examples of GDP component variables
Examples of C, I, G, and NX: If you spend money to renovate your hotel so that occupancy rates increase, that is private investment, but if you buy shares in a consortium to do the same thing it is saving. The former is included when measuring GDP (in I), the latter is not. However, when the consortium conducted its own expenditure on renovation, that expenditure would be included in GDP.
For example, if a hotel is a private home then renovation spending would be measured as Consumption, but if a government agency is converting the hotel into an office for civil servants the renovation spending would be measured as part of public sector spending (G).
If the renovation involves the purchase of a chandelier from abroad, that spending would also be counted as an increase in imports, so that NX would fall and the total GDP is affected by the purchase. (This highlights the fact that GDP is intended to measure domestic production rather than total consumption or spending. Spending is really a convenient means of estimating production.)
If a domestic producer is paid to make the chandelier for a foreign hotel, the situation would be reversed, and the payment would be counted in NX (positively, as an export). Again, GDP is attempting to measure production through the means of expenditure; if the chandelier produced had been bought domestically it would have been included in the GDP figures (in C or I) when purchased by a consumer or a business, but because it was exported it is necessary to 'correct' the amount consumed domestically to give the amount produced domestically. (As in Gross Domestic Product.)
Types of GDP and GDP growth

- Current GDP is GDP expressed in the current prices of the period being measured
- Nominal GDP growth is GDP growth in nominal prices (unadjusted for price changes).
- Real GDP growth is GDP growth adjusted for price changes.
Calculating the real GDP growth allows economists to determine if production increased or decreased, regardless of changes in the purchasing power of the currency.
The GDP income account
Another way of measuring GDP is to measure the total income payable in the GDP income accounts. In this situation, Gross Domestic Income (GDI) is sometimes used rather than Gross Domestic Product. This should provide the same figure as the expenditure method described above. (By definition, GDI=GDP. In practice, however, measurement errors will make the two figures slightly off when reported by national statistical agencies.)
The formula for GDP measured using the income approach, called GDP(I), is:
- GDP = Compensation of employees + Gross operating surplus + Gross mixed income + Taxes less subsidies on production and imports
- Compensation of employees (COE) measures the total remuneration to employees for work done. It includes wages and salaries, as well as employer contributions to social security and other such programs.
- Gross operating surplus (GOS) is the surplus due to owners of incorporated businesses. Often called profits, although only a subset of total costs are subtracted from gross output to calculate GOS.
- Gross mixed income (GMI) is the same measure as GOS, but for unincorporated businesses. This often includes most small businesses.
The sum of COE, GOS and GMI is called total factor income, and measures the value of GDP at factor (basic) prices.The difference between basic prices and final prices (those used in the expenditure calculation) is the total taxes and subsidies that the Government has levied or paid on that production. So adding taxes less subsidies on production and imports converts GDP at factor cost to GDP(I).
Another formula can be written as this:
- GDP = R + I + P + SA + W
where R = rents
I = interests
P = profits
SA = statistical adjustments (corporate income taxes, dividends, undistributed corporate profits)
W = wages
Measurement
International standards
The international standard for measuring GDP is contained in the book System of National Accounts (1993), which was prepared by representatives of the International Monetary Fund, European Union, Organization for Economic Co-operation and Development, United Nations and World Bank. The publication is normally referred to as SNA93 to distinguish it from the previous edition published in 1968 (called SNA68).
SNA93 provides a set of rules and procedures for the measurement of national accounts. The standards are designed to be flexible, to allow for differences in local statistical needs and conditions.
National measurement
Within each country GDP is normally measured by a national government statistical agency, as private sector organizations normally do not have access to the information required (especially information on expenditure and production by governments).
Interest rates
Net interest expense is a transfer payment in all sectors except the financial sector. Net interest expenses in the financial sector are seen as production and value added and are added to GDP.
Cross-border comparison
The level of GDP in different countries may be compared by converting their value in national currency according to either
- current currency exchange rate: GDP calculated by exchange rates prevailing on international currency markets
- purchasing power parity exchange rate: GDP calculated by purchasing power parity (PPP) of each currency relative to a selected standard (usually the United States dollar).
The relative ranking of countries may differ dramatically between the two approaches.
- The current exchange rate method converts the value of goods and services using global currency exchange rates. This can offer better indications of a country's international purchasing power and relative economic strength. For instance, if 10% of GDP is being spent on buying hi-tech foreign arms, the number of weapons purchased is entirely governed by current exchange rates, since arms are a traded product bought on the international market (there is no meaningful 'local' price distinct from the international price for high technology goods).
- The purchasing power parity method accounts for the relative effective domestic purchasing power of the average producer or consumer within an economy. This can be a better indicator of the living standards of less-developed countries because it compensates for the weakness of local currencies in world markets. (For example, India ranks 12th by nominal GDP but 4th by PPP). The PPP method of GDP conversion is most relevant to non-traded goods and services.
There is a clear pattern of the purchasing power parity method decreasing the disparity in GDP between high and low income (GDP) countries, as compared to the current exchange rate method. This finding is called the Penn effect.
For more information see Measures of national income and output.
Standard of living and GDP

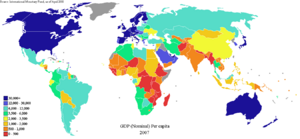
GDP per capita is often used as an indicator of standard of living in an economy, the rationale being that all citizens would benefit from their country's increased economic production.
The major advantages to using GDP per capita as an indicator of standard of living are that it is measured frequently, widely and consistently; frequently in that most countries provide information on GDP on a quarterly basis (which allows a user to spot trends more quickly), widely in that some measure of GDP is available for practically every country in the world (allowing crude comparisons between the standard of living in different countries), and consistently in that the technical definitions used within GDP are relatively consistent between countries, and so there can be confidence that the same thing is being measured in each country.
The major disadvantage of using GDP as an indicator of standard of living is that it is not, strictly speaking, a measure of standard of living. GDP is intended to be a measure of particular types of economic activity within a country. Nothing about the definition of GDP suggests that it is necessarily a measure of standard of living. For instance, in an extreme example, a country which exported 100 per cent of its production and imported nothing would still have a high GDP, but a very poor standard of living.
The argument in favour of using GDP is not that it is a good indicator of standard of living, but rather that (all other things being equal) standard of living tends to increase when GDP per capita increases. This makes GDP a proxy for standard of living, rather than a direct measure of it. GDP per capita can also be seen as a proxy of labour productivity. As the productivity of the workers increases, employers must compete for them by paying higher wages. Conversely, if productivity is low, then wages must be low or the businesses will not be able to make a profit.
There are a number of controversies about this use of GDP.
Limitations of GDP to judge the health of an economy
GDP is widely used by economists to gauge the health of an economy, as its variations are relatively quickly identified. However, its value as an indicator for the standard of living is considered to be limited. Criticisms of how the GDP is used include:
- Wealth distribution - GDP does not take disparity in incomes between the rich and poor into account. However, numerous Nobel-prize winning economists have disputed the importance of inequality as a factor in improving long-term economic growth. In fact, short term increases in inequality may even lead to long term decreases in inequality. See income inequality metrics for discussion of a variety of inequality-based economic measures.
- Voluntary work - GDP ignores voluntary work, such as domestic work. Unpaid work conducted on Free and Open Source Software (such as Linux) contribute nothing to GDP, but it was estimated that it would have cost more than a billion US dollars for a commercial company to develop. Also, if Free and Open Source Software became identical to its proprietary software counterparts, and the nation producing the propriety software stops buying proprietary software and switches to Free and Open Source Software, then the GDP of this nation would reduce, however there would be no reduction in economic production or standard of living. The work of New Zealand economist Marilyn Waring has highlighted that if a concerted attempt to factor in unpaid work were made, then it would in part, undo the injustices of unpaid (and in some cases, slave) labour, and also provide the political transparency and accountability necessary for democracy. Shedding some doubt on this claim, however, is the theory that won economist Douglass North the Nobel Prize in 1993. North argued that the creation and strengthening of the patent system, by encouraging private invention and enterprise, became the fundamental catalyst behind the Industrial Revolution in England.
- GDP also ignores subsistence production.
- What is being produced - GDP counts work that produces no net change or that results from repairing harm. For example, rebuilding after a natural disaster or war may produce a considerable amount of economic activity and thus boost GDP. The economic value of health care is another classic example — it may raise GDP if many people are sick and they are receiving expensive treatment, but it is not a desirable situation. Alternative economic measures, such as the standard of living or discretionary income per capita better measure the human utility of economic activity. See uneconomic growth.
- Quality of goods - People may buy cheap, low-durability goods over and over again, or they may buy high-durability goods less often. It is possible that the monetary value of the items sold in the first case is higher than that in the second case, in which case a higher GDP is simply the result of greater inefficiency and waste. (This is not always the case; durable goods are often more difficult to produce than flimsy goods, and consumers have a financial incentive to find the cheapest long-term option. With goods that are undergoing rapid change, such as in fashion or high technology, the short lifespan may increase customer satisfaction by allowing them to have newer products.)
- Externalities - GDP ignores externalities such as damage to the environment. GDP even views externalities as positive if work/production is required in response to the externalities.
- Sustainability of growth - GDP does not measure the sustainability of growth. A country may achieve a temporarily high GDP by over-exploiting natural resources or by misallocating investment. For example, the large deposits of phosphates gave the people of Nauru one of the highest per capita incomes on earth, but since 1989 their standard of living has declined sharply as the supply has run out. Oil-rich states can sustain high GDPs without industrializing, but this high level would no longer be sustainable if the oil runs out. Economies experiencing an economic bubble, such as a housing bubble or stock bubble, or a low private-saving rate tend to appear to grow faster owing to higher consumption, mortgaging their futures for present growth. Economic growth at the expense of environmental degradation can end up costing dearly to clean up; GDP does not account for this.
- Black market - Official GDP estimates may not take into account the black market, where the money spent is not registered, and the non-monetary economy, where no money comes into play at all, resulting in inaccurate or abnormally low GDP figures. For example, in countries with major business transactions occurring informally, portions of local economy are not easily registered. Bartering may be more prominent than the use of money, even extending to services (I helped you build your house ten years ago, so now you help me).
- One main problem in estimating GDP growth over time is that the purchasing power of money varies in different proportion for different goods, so when the GDP figure is deflated over time, GDP growth can vary greatly depending on the basket of goods used and the relative proportions used to deflate the GDP figure. For example, in the past 80 years the GDP per capita of the United States if measured by purchasing power of potatoes, did not grow significantly. But if it is measured by the purchasing power of eggs, it grew several times. For this reason, economists comparing multiple countries usually use a varied basket of goods.
- Cross-border comparisons of GDP can be inaccurate as they do not take into account local differences in the quality of goods, even when adjusted for purchasing power parity. This type of adjustment to an exchange rate is controversial because of the difficulties of finding comparable baskets of goods to compare purchasing power across countries. For instance, people in country A may consume the same number of locally produced apples as in country B, but apples in country A are of a more tasty variety. This difference in material well being will not show up in GDP statistics. This is especially true for goods that are not traded globally, such as housing.
- Transfer pricing on cross-border trades between associated companies may distort import and export measures.
- As a measure of actual sale prices, GDP does not capture the economic surplus between the price paid and subjective value received, and can therefore underestimate aggregate utility.
- Austrian economist critique - Criticisms of GDP figures were expressed by Austrian economist Frank Shostak[1]. Among other criticisms, he stated the following:
He goes on:The GDP framework cannot tell us whether final goods and services that were produced during a particular period of time are a reflection of real wealth expansion, or a reflection of capital consumption.
Austrian economists are critical of the basic idea of attempting to quantify national output. Shostak quotes Austrian economist Ludwig von Mises:For instance, if a government embarks on the building of a pyramid, which adds absolutely nothing to the well-being of individuals, the GDP framework will regard this as economic growth. In reality, however, the building of the pyramid will divert real funding from wealth-generating activities, thereby stifling the production of wealth.
The attempt to determine in money the wealth of a nation or the whole mankind are as childish as the mystic efforts to solve the riddles of the universe by worrying about the dimension of the pyramid of Cheops.
Simon Kuznets the inventor of the GDP, in his very first report to the US Congress in 1934 said[2]:
...the welfare of a nation [can] scarcely be inferred from a measure of national income...
In 1962, Kuznets stated[3]:
Distinctions must be kept in mind between quantity and quality of growth, between costs and returns, and between the short and long run. Goals for more growth should specify more growth of what and for what.
Alternatives to GDP
- Human Development Index (HDI)
HDI uses GDP as a part of its calculation and then factors in indicators of life expectancy and education levels.
- Genuine Progress Indicator (GPI) or Index of Sustainable Economic Welfare (ISEW)
The GPI and the similar ISEW attempt to address many of the above criticisms by taking the same raw information supplied for GDP and then adjust for income distribution, add for the value of household and volunteer work, and subtract for crime and pollution.
- Wealth Estimates
The World Bank has developed a system for combining monetary wealth with intangible wealth (institutions and human capital) and environmental capital.[4]
Some people have looked beyond standard of living at a broader sense of quality of life or well-being.
- European Quality of Life Survey
This survey, the first wave of which was published in 2005, assessed quality of life across European countries through a series of questions on overall subjective life satisfaction, satisfaction with different aspects of life, and sets of questions used to calculate deficits of time, loving, being and having.[5]
- Gross National Happiness
The Centre for Bhutanese Studies in Bhutan is currently working on a complex set of subjective and objective indicators to measure 'national happiness' in various domains (living standards, health, education, eco-system diversity and resilience, cultural vitality and diversity, time use and balance, good governance, community vitality and psychological well-being). This set of indicators would be used to assess progress towards Gross National Happiness, which they have already identified as being the nation's priority, above GDP.
- Happy Planet Index
The Happy Planet Index (HPI) is an index of human well-being and environmental impact, introduced by the New Economics Foundation (NEF), in July 2006. It measures the environmental efficiency with which human well-being is achieved within a given country or group. Human well-being is defined in terms of subjective life satisfaction and life expectancy.
Lists of countries by their GDP
- List of countries by GDP (nominal), (per capita)
- List of countries by GDP (PPP), (per capita), (per hour)
- List of countries by GDP (real) growth rate, (per capita)
- List of countries by GDP sector composition
- List of countries by future GDP estimates (PPP), (per capita), (nominal)
- List of countries by past GDP (PPP), (nominal)
See also
- Eco-sufficiency
- Economic growth
- Economic reports
- GDP deflator
- Genuine Progress Indicator (GPI)
- GNP
- Green Gross Domestic Product
- Gross national happiness
- Gross Output
- Gross regional domestic product
- Gross value added
- Gross National Income
- Gross world product
- Human Development Index
- Happy Planet Index (HPI)
- Income inequality metrics
- Intermediate consumption
- Measures of national income and output
- National accounts
- Natural gross domestic product
- Purchasing Power Parity
- Value added
|
|||||||||||||||||||||||||
References
- ↑ http://mises.org/story/770
- ↑ Simon Kuznets, 1934. "National Income, 1929-1932". 73rd US Congress, 2d session, Senate document no. 124, page 7. http://library.bea.gov/u?/SOD,888
- ↑ Simon Kuznets. "How To Judge Quality". The New Republic, October 20, 1962
- ↑ "World Bank wealth estimates".
- ↑ "First European Quality of Life Survey".
External links
Global
- Australian Bureau of Statistics Manual on GDP measurement
- GDP-indexed bonds
- GDP scaled maps
- Euro area GDP growth rate (since 1996) as compared to the Bank Rate (since 2000)
- World Development Indicators (WDI)
- Economist Country Briefings
- UN Statistical Databases
- GDP Animated Cartogram.
Data
- Bureau of Economic Analysis: Official United States GDP data
- Historicalstatistics.org: Links to historical statistics on GDP for different countries and regions
- Complete listing of countries by GDP: Current Exchange Rate Method Purchasing Power Parity Method
- Historical US GDP (1790 to 2005)
Articles and books
- What's wrong with the GDP?
- Limitations of GDP Statistics by Schenk, Robert.
- whether output and CPI inflation are mismeasured, by Nouriel Roubini and David Backus, in Lectures in Macroeconomics
- "Measurement of the Aggregate Economy", chapter 22 of Dr. Roger A. McCain's Essential Principles of Economics: A Hypermedia Text
- Growth, Accumulation, Crisis: With New Macroeconomic Data for Sweden 1800-2000 by Rodney Edvinsson
- Clifford Cobb, Ted Halstead and Jonathan Rowe. "If the GDP is up, why is America down?" The Atlantic Monthly, vol. 276, no. 4, October 1995, pages 59-78.