Franklin County, Illinois
| Franklin County, Illinois | |
| Map | |
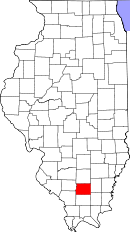
 Location in the state of Illinois |
|
 Illinois's location in the U.S. |
|
| Statistics | |
| Founded | January 2, 1818 |
|---|---|
| Seat | Benton |
| Largest city | West Frankfort |
| Area - Total - Land - Water |
431 sq mi (1,117 km²) 412 sq mi (1,067 km²) 19 sq mi (50 km²), 4.48% |
| Population - (2000) - Density |
39,018 95/sq mi (37/km²) |
| Time zone | Central: UTC-6/-5 |
Franklin County is a county located in the U.S. state of Illinois. As of 2000, the population was 39,018. Its county seat is Benton.[1]
Contents |
History
Franklin County was established on January 2, 1818 and formed out of Gallatin and White Counties. It was named for Benjamin Franklin.[2]
The first settlers arrived in Franklin County in 1804. This group included six brothers named Jordan. They settled near the southeastern corner of the County, near modern Thompsonville. The first year they built a pole shed, covered with brush, chinked with mud, thatched with grass, and open to the south. They kept a fire burning outside the south face. This was called the Jordan Settlement.
In the winter of 1809, during Tecumseh's War, there was fear of attacks by Indians. Governor Edwards issued a call for the building of forts. Frank Jordan built two forts. The one at the settlement was called "Jordan's Fort". The second was several miles west. It was called "Frank's Fort", which eventually became West Frankfort.
Geography
According to the U.S. Census Bureau, the county has a total area of 431 square miles (1,117 km²), of which, 412 square miles (1,067 km²) of it is land and 19 square miles (50 km²) of it (4.48%) is water. Wayne Fitzgerrell State Recreation Area is located in this county.

Adjacent counties
- Jefferson County (north)
- Hamilton County (east)
- Saline County (southeast)
- Williamson County (south)
- Jackson County (southwest)
- Perry County (west)
Major highways
 Interstate 57
 Illinois Route 14
 Illinois Route 34
 Illinois Route 148
 Illinois Route 149
 Illinois Route 154
Political subdivisions
Cities and towns
- Benton
- Christopher
- Orient
- Sesser
- West Frankfort
- Zeigler
Villages
- Buckner
- Ewing
- Freeman Spur (north half)
- Hanaford
- Macedonia (west half)
- North City
- Royalton
- Thompsonville
- Valier
- West City
Townships
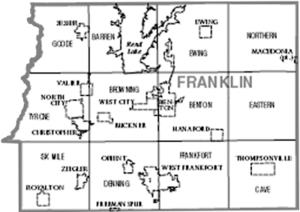
Franklin County is divided into twelve townships:
|
|
Demographics

| Historical populations | |||
|---|---|---|---|
| Census | Pop. | %± | |
| 1820 | 1,763 |
|
|
| 1830 | 4,083 | 131.6% | |
| 1840 | 3,682 | −9.8% | |
| 1850 | 5,681 | 54.3% | |
| 1860 | 9,393 | 65.3% | |
| 1870 | 12,652 | 34.7% | |
| 1880 | 16,129 | 27.5% | |
| 1890 | 17,138 | 6.3% | |
| 1900 | 19,675 | 14.8% | |
| 1910 | 25,943 | 31.9% | |
| 1920 | 57,293 | 120.8% | |
| 1930 | 59,442 | 3.8% | |
| 1940 | 53,137 | −10.6% | |
| 1950 | 48,685 | −8.4% | |
| 1960 | 39,281 | −19.3% | |
| 1970 | 38,329 | −2.4% | |
| 1980 | 43,201 | 12.7% | |
| 1990 | 40,319 | −6.7% | |
| 2000 | 39,018 | −3.2% | |
| UVa Census Browser 1820-1890[3] Illinois Counties 1900-1990[4] |
|||
As of the U.S. Census of 2000,[5] there were 39,018 people, 16,408 households, and 10,976 families residing in the county. The population density was 95 people per square mile (37/km²). There were 18,105 housing units at an average density of 44 per square mile (17/km²). The racial makeup of the county was 98.63% White, 0.15% Black or African American, 0.22% Native American, 0.18% Asian, 0.01% Pacific Islander, 0.14% from other races, and 0.66% from two or more races. 0.64% of the population were Hispanic or Latino of any race. 23.6% were of American, 16.2% German, 14.9% English, 11.4% Irish and 6.6% Italian ancestry according to Census 2000. 98.2% spoke English and 1.0% Spanish as their first language.
There were 16,408 households out of which 28.20% had children under the age of 18 living with them, 53.00% were married couples living together, 10.10% had a female householder with no husband present, and 33.10% were non-families. 29.80% of all households were made up of individuals and 15.80% had someone living alone who was 65 years of age or older. The average household size was 2.34 and the average family size was 2.89.
In the county the population was spread out with 23.00% under the age of 18, 7.90% from 18 to 24, 26.20% from 25 to 44, 24.30% from 45 to 64, and 18.70% who were 65 years of age or older. The median age was 40 years. For every 100 females there were 91.90 males. For every 100 females age 18 and over, there were 89.00 males.
The median income for a household in the county was $28,411, and the median income for a family was $36,294. Males had a median income of $31,429 versus $19,664 for females. The per capita income for the county was $15,407. About 12.60% of families and 16.20% of the population were below the poverty line, including 24.10% of those under age 18 and 9.60% of those age 65 or over.
References
- United States Census Bureau 2007 TIGER/Line Shapefiles
- United States Board on Geographic Names (GNIS)
- United States National Atlas
- ↑ "Find a County". National Association of Counties. Retrieved on 2008-01-31.
- ↑ Adams, James N. (compiler), Keller, William E., ed., Illinois Place Names, Springfield: Illinois State Historical Society, 1989, pp. 581, ISBN 0912226242
- ↑ Historial Census Browser, University of Virginia, Geospacial and Statistical Data Center, 2004, http://fisher.lib.virginia.edu/collections/stats/histcensus/index.html
- ↑ Illinois Counties 1900-1990, U.S. Census Bureau, http://www.census.gov/population/cencounts/il190090.txt
- ↑ "American FactFinder". United States Census Bureau. Retrieved on 2008-01-31.
|
||||||||||||||||||||
|