Electrocardiogram

An electrocardiogram (ECG or EKG) is a recording of the electrical activity of the heart over time produced by an electrocardiograph, usually in a noninvasive recording via skin electrodes. Its name is made of different parts: electro, because it is related to electrical activity, cardio, Greek for heart, gram, a Greek root meaning "to write". In the US, the abbreviation "EKG" , (abbreviated from the German Elektrokardiogramm) is often preferred over "ECG", while "ECG" is used universally in the UK and many other countries. It is preferred as "EKG" in the US because doctor's handwriting of "ECG" can often be confused as "EEG" when transcribing orders or with echocardiography which is also abbreviated "ECG".
Sympathetic electrical impulses in the heart originate in the sinoatrial node and travel through the heart muscle where they impart electrical initiation of systole or contraction of the heart. The electrical waves can be measured at selectively placed electrodes (electrical contacts) on the skin. Electrodes on different sides of the heart measure the activity of different parts of the heart muscle. An EKG displays the voltage between pairs of these electrodes, and the muscle activity that they measure, from different directions, also understood as vectors. This display indicates the overall rhythm of the heart and weaknesses in different parts of the heart muscle. It is the best way to measure and diagnose abnormal rhythms of the heart,[1] particularly abnormal rhythms caused by damage to the conductive tissue that carries electrical signals, or abnormal rhythms caused by levels of dissolved salts (electrolytes), such as potassium, that are too high or low.[2] In myocardial infarction (MI), the ECG can identify damaged heart muscle. But it can only identify damage to muscle in certain areas, so it can't rule out damage in other areas.[3] The ECG cannot reliably measure the pumping ability of the heart; for which ultrasound-based (echocardiography) or nuclear medicine tests are used.
Contents |
History
Alexander Muirhead is reported to have attached wires to a feverish patient's wrist to obtain a record of the patient's heartbeat while studying for his Doctor of Science (in electricity) in 1872 at St Bartholomew's Hospital.[4] This activity was directly recorded and visualized using a Lippmann capillary electrometer by the British physiologist John Burdon Sanderson.[5] The first to systematically approach the heart from an electrical point-of-view was Augustus Waller, working in St Mary's Hospital in Paddington, London.[6] His electrocardiograph machine consisted of a Lippmann capillary electrometer fixed to a projector. The trace from the heartbeat was projected onto a photographic plate which was itself fixed to a toy train. This allowed a heartbeat to be recorded in real time. In 1911 he still saw little clinical application for his work.
The breakthrough came when Willem Einthoven, working in Leiden, The Netherlands, used the string galvanometer that he invented in 1901 [3]. This device which was much more sensitive than both the capillary electrometer that Waller used and the string galvanometer that had been invented separately in 1897 by the French engineer Clément Ader.[7]
Einthoven assigned the letters P, Q, R, S and T to the various deflections, and described the electrocardiographic features of a number of cardiovascular disorders. In 1924, he was awarded the Nobel Prize in Medicine for his discovery.[8]
Though the basic principles of that era are still in use today, there have been many advances in electrocardiography over the years. The instrumentation, for example, has evolved from a cumbersome laboratory apparatus to compact electronic systems that often include computerized interpretation of the electrocardiogram.[9]
ECG graph paper
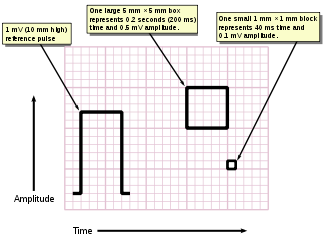
Timed interpretation of an EKG was once incumbent to a stylus and paper speed. Computational analysis now allows considerable study of heart rate variability. A typical electrocardiograph runs at a paper speed of 25 mm/s, although faster paper speeds are occasionally used. Each small block of ECG paper is 1 mm². At a paper speed of 25 mm/s, one small block of ECG paper translates into 0.04 s (or 40 ms). Five small blocks make up 1 large block, which translates into 0.20 s (or 200 ms). Hence, there are 5 large blocks per second. A diagnostic quality 12 lead ECG is calibrated at 10 mm/mV, so 1 mm translates into 0.1 mV. A calibration signal should be included with every record. A standard signal of 1 mV must move the stylus vertically 1 cm, that is two large squares on ECG paper.
Filter selection
Modern ECG monitors offer multiple filters for signal processing. The most common settings are monitor mode and diagnostic mode. In monitor mode, the low frequency filter (also called the high-pass filter because signals above the threshold are allowed to pass) is set at either 0.5 Hz or 1 Hz and the high frequency filter (also called the low-pass filter because signals below the threshold are allowed to pass) is set at 40 Hz. This limits artifact for routine cardiac rhythm monitoring. The high-pass filter helps reduce wandering baseline and the low pass filter helps reduce 50 or 60 Hz power line noise (the power line network frequency differs between 50 and 60 Hz in different countries). In diagnostic mode, the high pass filter is set at 0.05 Hz, which allows accurate ST segments to be recorded. The low pass filter is set to 40, 100, or 150 Hz. Consequently, the monitor mode ECG display is more filtered than diagnostic mode, because its bandpass is narrower.[10]
Leads
The word lead has two meanings in electrocardiography: it refers to either the wire that connects an electrode to the electrocardiograph, or (more commonly) to a combination of electrodes that form an imaginary line in the body along which the electrical signals are measured. Thus, the term loose lead artifact uses the former meaning, while the term 12 lead ECG uses the latter. In fact, a 12 lead electrocardiograph usually only uses 10 wires/electrodes. The latter definition of lead is the one used here.
An electrocardiogram is obtained by measuring electrical potential between various points of the body using a biomedical instrumentation amplifier. A lead records the electrical signals of the heart from a particular combination of recording electrodes which are placed at specific points on the patient's body.
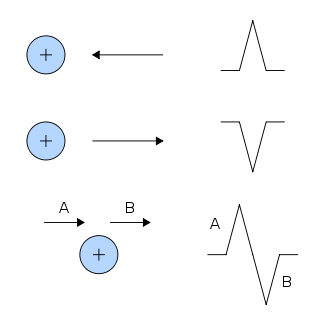
- When a depolarization wavefront (or mean electrical vector) moves toward a positive electrode, it creates a positive deflection on the ECG in the corresponding lead.
- When a depolarization wavefront (or mean electrical vector) moves away from a positive electrode, it creates a negative deflection on the ECG in the corresponding lead.
- When a depolarization wavefront (or mean electrical vector) moves perpendicular to a positive electrode, it creates an equiphasic (or isodiphasic) complex on the ECG. It will be positive as the depolarization wavefront (or mean electrical vector) approaches (A), and then become negative as it passes by (B).
There are two types of leads—unipolar and bipolar. The former have an indifferent electrode at the center of the Einthoven’s triangle (which can be likened to the ‘neutral’ of a wall socket) at zero potential. The direction of these leads is from the “center” of the heart radially outward. These include the precordial (chest) leads and augmented limb leads—VR, VL, & VF. The bipolar type, in contrast, has both electrodes at some potential, with the direction of the corresponding lead being from the electrode at lower potential to the one at higher potential, e.g., in limb lead I, the direction is from left to right. These include the limb leads—I, II, and III.
Note that the colouring scheme for leads varies by country.
Limb
Leads I, II and III are the so-called limb leads because at one time, the subjects of electrocardiography had to literally place their arms and legs in buckets of salt water in order to obtain signals for Einthoven's string galvanometer. They form the basis of what is known as Einthoven's triangle.[4] Eventually, electrodes were invented that could be placed directly on the patient's skin. Even though the buckets of salt water are no longer necessary, the electrodes are still placed on the patient's arms and legs to approximate the signals obtained with the buckets of salt water. They remain the first three leads of the modern 12 lead ECG.
![[4]](http://nobelprize.org/medicine/educational/ecg/images/triangle.gif)
- Lead I is a dipole with the negative (white) electrode on the right arm and the positive (black) electrode on the left arm.
- Lead II is a dipole with the negative (white) electrode on the right arm and the positive (red) electrode on the left leg.
- Lead III is a dipole with the negative (black) electrode on the left arm and the positive (red) electrode on the left leg.
Augmented limb

Leads aVR, aVL, and aVF are augmented limb leads. They are derived from the same three electrodes as leads I, II, and III. However, they view the heart from different angles (or vectors) because the negative electrode for these leads is a modification of Wilson's central terminal, which is derived by adding leads I, II, and III together and plugging them into the negative terminal of the EKG machine. This zeroes out the negative electrode and allows the positive electrode to become the "exploring electrode" or a unipolar lead. This is possible because Einthoven's Law states that I + (-II) + III = 0. The equation can also be written I + III = II. It is written this way (instead of I - II + III = 0) because Einthoven reversed the polarity of lead II in Einthoven's triangle, possibly because he liked to view upright QRS complexes. Wilson's central terminal paved the way for the development of the augmented limb leads aVR, aVL, aVF and the precordial leads V1, V2, V3, V4, V5, and V6.
- Lead aVR or "augmented vector right" has the positive electrode (white) on the right arm. The negative electrode is a combination of the left arm (black) electrode and the left leg (red) electrode, which "augments" the signal strength of the positive electrode on the right arm.
- Lead aVL or "augmented vector left" has the positive (black) electrode on the left arm. The negative electrode is a combination of the right arm (white) electrode and the left leg (red) electrode, which "augments" the signal strength of the positive electrode on the left arm.
- Lead aVF or "augmented vector foot" has the positive (red) electrode on the left leg. The negative electrode is a combination of the right arm (white) electrode and the left arm (black) electrode, which "augments" the signal of the positive electrode on the left leg.
The augmented limb leads aVR, aVL, and aVF are amplified in this way because the signal is too small to be useful when the negative electrode is Wilson's central terminal. Together with leads I, II, and III, augmented limb leads aVR, aVL, and aVF form the basis of the hexaxial reference system, which is used to calculate the heart's electrical axis in the frontal plane.
Precordial
The precordial leads V1, V2, V3, V4, V5, and V6 are placed directly on the chest. Because of their close proximity to the heart, they do not require augmentation. Wilson's central terminal is used for the negative electrode, and these leads are considered to be unipolar. The precordial leads view the heart's electrical activity in the so-called horizontal plane. The heart's electrical axis in the horizontal plane is referred to as the Z axis.
Leads V1, V2, and V3 are referred to as the right precordial leads and V4, V5, and V6 are referred to as the left precordial leads.
The QRS complex should be negative in lead V1 and positive in lead V6. The QRS complex should show a gradual transition from negative to positive between leads V2 and V4. The equiphasic lead is referred to as the transition lead. When the transition occurs earlier than lead V3, it is referred to as an early transition. When it occurs later than lead V3, it is referred to as a late transition. There should also be a gradual increase in the amplitude of the R wave between leads V1 and V4. This is known as R wave progression. Poor R wave progression is a nonspecific finding. It can be caused by conduction abnormalities, myocardial infarction, cardiomyopathy, and other pathological conditions.
- Lead V1 is placed in the fourth intercostal space to the right of the sternum.
- Lead V2 is placed in the fourth intercostal space to the left of the sternum.
- Lead V3 is placed directly between leads V2 and V4.
- Lead V4 is placed in the fifth intercostal space in the midclavicular line (even if the apex beat is displaced).
- Lead V5 is placed horizontally with V4 in the anterior axillary line
- Lead V6 is placed horizontally with V4 and V5 in the midaxillary line.
Ground
An additional electrode (usually green) is present in modern four-lead and twelve-lead ECGs. This is the ground lead and is placed on the right leg by convention, although in theory it can be placed anywhere on the body. With a three-lead ECG, when one dipole is viewed, the remaining lead becomes the ground lead by default.
Waves and intervals

A typical ECG tracing of a normal heartbeat (or cardiac cycle) consists of a P wave, a QRS complex and a T wave. A small U wave is normally visible in 50 to 75% of ECGs. The baseline voltage of the electrocardiogram is known as the isoelectric line. Typically the isoelectric line is measured as the portion of the tracing following the T wave and preceding the next P wave.
P wave
During normal atrial depolarization, the main electrical vector is directed from the SA node towards the AV node, and spreads from the right atrium to the left atrium. This turns into the P wave on the ECG, which is upright in II, III, and aVF (since the general electrical activity is going toward the positive electrode in those leads), and inverted in aVR (since it is going away from the positive electrode for that lead). A P wave must be upright in leads II and aVF and inverted in lead aVR to designate a cardiac rhythm as Sinus Rhythm.
- The relationship between P waves and QRS complexes helps distinguish various cardiac arrhythmias.
- The shape and duration of the P waves may indicate atrial enlargement.
QRS complex
- See also: Electrical conduction system of the heart
The QRS complex is a structure on the ECG that corresponds to the depolarization of the ventricles. Because the ventricles contain more muscle mass than the atria, the QRS complex is larger than the P wave. In addition, because the His/Purkinje system coordinates the depolarization of the ventricles, the QRS complex tends to look "spiked" rather than rounded due to the increase in conduction velocity. A normal QRS complex is 0.06 to 0.10 sec (60 to 100 ms) in duration represented by three small squares or less, but any abnormality of conduction takes longer, and causes widened QRS complexes.
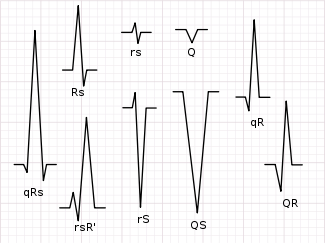
Not every QRS complex contains a Q wave, an R wave, and an S wave. By convention, any combination of these waves can be referred to as a QRS complex. However, correct interpretation of difficult ECGs requires exact labeling of the various waves. Some authors use lowercase and capital letters, depending on the relative size of each wave. For example, an Rs complex would be positively deflected, while a rS complex would be negatively deflected. If both complexes were labeled RS, it would be impossible to appreciate this distinction without viewing the actual ECG.
- The duration, amplitude, and morphology of the QRS complex is useful in diagnosing cardiac arrhythmias, conduction abnormalities, ventricular hypertrophy, myocardial infarction, electrolyte derangements, and other disease states.
- Q waves can be normal (physiological) or pathological. Pathological Q waves refer to Q waves that have a height of 25% or more than that of the partner R wave and/or have a width of greater than 0.04 seconds. Normal Q waves, when present, represent depolarization of the interventricular septum. For this reason, they are referred to as septal Q waves, and can be appreciated in the lateral leads I, aVL, V5 and V6.
- Q waves greater than 1/3 the height of the R wave, greater than 0.04 sec (40 ms) in duration, or in the right precordial leads are considered to be abnormal, and may represent myocardial infarction.
- "Buried" inside the QRS wave is the atrial repolarization wave, which resembles an inverse P wave. It is far smaller in magnitude than the QRS and is therefore obscured by it.

PR/PQ interval
The PR interval is measured from the beginning of the P wave to the beginning of the QRS complex. It is usually 120 to 200 ms long. On an ECG tracing, this corresponds to 3 to 5 small boxes. In case a Q wave was measured with a ECG the PR interval is also commonly named PQ interval instead.
- A PR interval of over 200 ms may indicate a first degree heart block.
- A short PR interval may indicate a pre-excitation syndrome via an accessory pathway that leads to early activation of the ventricles, such as seen in Wolff-Parkinson-White syndrome.
- A variable PR interval may indicate other types of heart block.
- PR segment depression may indicate atrial injury or pericarditis.
- Variable morphologies of P waves in a single ECG lead is suggestive of an ectopic pacemaker rhythm such as wandering pacemaker or multifocal atrial tachycardia
ST segment
The ST segment connects the QRS complex and the T wave and has a duration of 0.08 to 0.12 sec (80 to 120 ms). It starts at the J point (junction between the QRS complex and ST segment) and ends at the beginning of the T wave. However, since it is usually difficult to determine exactly where the ST segment ends and the T wave begins, the relationship between the RT segment and T wave should be examined together. The typical ST segment duration is usually around 0.08 sec (80 ms). It should be essentially level with the PR and TP segment.
- The normal ST segment has a slight upward concavity.
- Flat, downsloping, or depressed ST segments may indicate coronary ischemia.
- ST segment elevation may indicate myocardial infarction. An elevation of >1mm and longer than 80 milliseconds following the J-point. This measure has a false positive rate of 15-20% (which is slightly higher in women than men) and a false negative rate of 20-30%.[11]
T wave
The T wave represents the repolarization (or recovery) of the ventricles. The interval from the beginning of the QRS complex to the apex of the T wave is referred to as the absolute refractory period. The last half of the T wave is referred to as the relative refractory period (or vulnerable period).
In most leads, the T wave is positive. However, a negative T wave is normal in lead aVR. Lead V1 may have a positive, negative, or biphasic T wave. In addition, it is not uncommon to have an isolated negative T wave in lead III, aVL, or aVF.
- Inverted (or negative) T waves can be a sign of coronary ischemia, Wellens' syndrome, left ventricular hypertrophy, or CNS disorder.
- Tall or "tented" symmetrical T waves may indicate hyperkalemia. Flat T waves may indicate coronary ischemia or hypokalemia.
- The earliest electrocardiographic finding of acute myocardial infarction is sometimes the hyperacute T wave, which can be distinguished from hyperkalemia by the broad base and slight asymmetry.
- When a conduction abnormality (e.g., bundle branch block, paced rhythm) is present, the T wave should be deflected opposite the terminal deflection of the QRS complex. This is known as appropriate T wave discordance.
QT interval
The QT interval is measured from the beginning of the QRS complex to the end of the T wave. Normal values for the QT interval are between 0.30 and 0.44 (0.45 for women) seconds. The QT interval as well as the corrected QT interval are important in the diagnosis of long QT syndrome and short QT syndrome. The QT interval varies based on the heart rate, and various correction factors have been developed to correct the QT interval for the heart rate. The QT interval represents on an ECG the total time needed for the ventricles to depolarize and repolarize.
The most commonly used method for correcting the QT interval for rate is the one formulated by Bazett and published in 1920.[12] Bazett's formula is 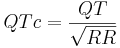 , where QTc is the QT interval corrected for rate, and RR is the interval from the onset of one QRS complex to the onset of the next QRS complex, measured in seconds. However, this formula tends to be inaccurate, and over-corrects at high heart rates and under-corrects at low heart rates.
QTc may also be found via the following formula: QTc = QT + 1.75(Ventricular Rate - 60).
U wave
The U wave is not always seen. It is typically small, and, by definition, follows the T wave. U waves are thought to represent repolarization of the papillary muscles or Purkinje fibers. Prominent U waves are most often seen in hypokalemia, but may be present in hypercalcemia, thyrotoxicosis, or exposure to digitalis, epinephrine, and Class 1A and 3 antiarrhythmics, as well as in congenital long QT syndrome and in the setting of intracranial hemorrhage. An inverted U wave may represent myocardial ischemia or left ventricular volume overload.[13]
Clinical lead groups
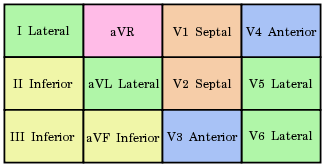
There are twelve leads in total, each recording the electrical activity of the heart from a different perspective, which also correlate to different anatomical areas of the heart for the purpose of identifying acute coronary ischemia or injury. Two leads that look at the same anatomical area of the heart are said to be contiguous (see color coded chart).
- The inferior leads (leads II, III and aVF) look at electrical activity from the vantage point of the inferior (or diaphragmatic) surface.
- The lateral leads (I, aVL, V5 and V6) look at the electrical activity from the vantage point of the lateral wall of left ventricle. The positive electrode for leads I and aVL should be located distally on the left arm and because of which, leads I and aVL are sometimes referred to as the high lateral leads. Because the positive electrodes for leads V5 and V6 are on the patient's chest, they are sometimes referred to as the low lateral leads.
- The septal leads, V1 and V2 look at electrical activity from the vantage point of the septal wall of the ventricles.
- The anterior leads, V3 and V4 look at electrical activity from the vantage point of the anterior surface of the heart.
- In addition, any two precordial leads that are next to one another are considered to be contiguous. For example, even though V4 is an anterior lead and V5 is a lateral lead, they are contiguous because they are next to one another.
- Lead aVR offers no specific view of the left ventricle. Rather, it views the inside of the endocardial wall to the surface of the right atrium, from its perspective on the right shoulder.
Axis

The heart's electrical axis refers to the general direction of the heart's depolarization wavefront (or mean electrical vector) in the frontal plane. It is usually oriented in a right shoulder to left leg direction, which corresponds to the left inferior quadrant of the hexaxial reference system, although -30o to +90o is considered to be normal.
- Left axis deviation (-30o to -90o) may indicate left anterior fascicular block or Q waves from inferior MI. Left axis deviation is considered normal in pregnant women and those with emphysema.
- Right axis deviation (+90o to +180o) may indicate left posterior fascicular block, Q waves from high lateral MI, or a right ventricular strain pattern. Right deviation is considered normal in children and is a standard effect of dextrocardia.
- Extreme right axis deviation (+180o to -90o) is rare, and considered an 'electrical no-man's land'.
- In the setting of right bundle branch block, right or left axis deviation may indicate bifascicular block.
Electrocardiogram heterogeneity
Electrocardiogram (ECG) heterogeneity is a measurement of the amount of variance between one ECG waveform and the next. This heterogeneity can be measured by placing multiple ECG electrodes on the chest and by then computing the variance in waveform morphology across the signals obtained from these electrodes. Recent research suggests that ECG heterogeneity often precedes dangerous cardiac arrhythmias
Background
There are over 350,000 cases of sudden cardiac death (SCD) in the United States each year, and over twenty percent of these cases involve people with no outward signs of serious heart disease. For decades, researchers have been attempting to come up with methods of identifying electrocardiogram (ECG) patterns that reliably precede dangerous arrhythmias. As these methods are found, devices are being created that monitor the heart in order to detect the onset of dangerous rhythms and to correct them before they cause death.
Research
Research being conducted[14] suggests that a crescendo in ECG heterogeneity, both in the R-wave and the T-wave, often signals the start of ventricular fibrillation. In patients with coronary artery disease, exercise increases T-wave heterogeneity, but this effect is not seen in normal patients. These results, when combined with other pieces of emerging evidence, suggest that R-wave and T-wave heterogeneity both have predictive value.
Future applications
In the future, researchers hope to automate the process of heterogeneity detection and to augment the clinical evidence supporting the validity of ECG heterogeneity as a predictor of arrhythmia. Someday soon, implantable devices may be programmed to measure and track heterogeneity. These devices could potentially help ward off arrhythmias by stimulating nerves such as the vagus nerve, by delivering drugs such as beta-blockers, and if necessary, by defibrillating the heart.[15]
See also
- Advanced cardiac life support (ACLS)
- Angiogram
- Ballistocardiograph
- Bundle branch block
- Cardiac cycle
- Echocardiogram
- Electrical conduction system of the heart
- Electrocardiogram technician
- Electroencephalography
- Electrogastrogram
- Electropalatograph
- Electroretinography
- Heart rate monitor
- Holter monitor
- Intrinsicoid deflection
- Myocardial infarction
- Treacherous technician syndrome
References
- ↑ Braunwald E. (Editor), Heart Disease: A Textbook of Cardiovascular Medicine, Fifth Edition, p. 108, Philadelphia, W.B. Saunders Co., 1997. ISBN 0-7216-5666-8.
- ↑ "The clinical value of the ECG in noncardiac conditions." Chest 2004; 125(4): 1561-76. PMID 15078775
- ↑ "2005 American Heart Association Guidelines for Cardiopulmonary Resuscitation and Emergency Cardiovascular Care - Part 8: Stabilization of the Patient With Acute Coronary Syndromes." Circulation 2005; 112: IV-89 - IV-110.
- ↑ Ronald M. Birse, rev. Patricia E. Knowlden [1] Oxford Dictionary of National Biography 2004 (Subscription required) - (original source is his biography written by his wife - Elizabeth Muirhead. Alexander Muirhead 1848 - 1920. Oxford, Blackwell: privately printed 1926.)
- ↑ Burdon Sanderson J (1878). "Experimental results relating to the rhythmical and excitatory motions of the ventricle of the frog heart". Proc Roy Soc Lond 27: 410–14. doi:.
- ↑ Waller AD (1887). "A demonstration on man of electromotive changes accompanying the heart's beat". J Physiol (Lond) 8: 229–34.
- ↑ Einthoven W. Un nouveau galvanometre. Arch Neerl Sc Ex Nat 1901; 6:625
- ↑ Cooper J (1986). "Electrocardiography 100 years ago. Origins, pioneers, and contributors". N Engl J Med 315 (7): 461–4. PMID 3526152.
- ↑ Mark, Jonathan B. (1998). Atlas of cardiovascular monitoring. New York: Churchill Livingstone. ISBN 0443088918..
- ↑ Mark JB "Atlas of Cardiovascular Monitoring." p. 130. New York: Churchill Livingstone, 1998. ISBN 0-443-08891-8.
- ↑ Sabatine MS (2000). Pocket Medicine (Pocket Notebook). Lippincott Williams & Wilkins. ISBN 0-7817-1649-7.
- ↑ Bazett HC (1920). "An analysis of the time-relations of electrocardiograms". Heart 7: 353–70.
- ↑ Conrath C, Opthof T (2005). "The patient U wave". Cardiovasc Res 67 (2): 184–6. doi:. PMID 15979057.
- ↑ In the lab of Richard L. Verrier of Harvard Medical School
- ↑ Verrier, Richard L. “Dynamic Tracking of ECG Heterogeneity to Estimate Risk of Life-threatening Arrhythmias.” CIMIT Forum. September 25, 2007.
Conference references
- Verrier, Richard L. “Dynamic Tracking of ECG Heterogeneity to Estimate Risk of Life-threatening Arrhythmias.” CIMIT Forum. September 25, 2007.
External links
- electrocardiogram ECG
- Learn the ECG online 24/7 with educational video, quizzes and crosswords
- CIMIT Center for Integration of Medicine and Innovative Technology
- ECG Interpretation Video
- ECGpedia: Course for interpretation of ECG
- The whole ECG - A basic ECG primer
- 12-lead ECG library
- Simulation tool to demonstrate and study the relation between the electric activity of the heart and the ECG
- ECG information from Children's Hospital Heart Center, Seattle.
- ECG Challenge from the ACC D2B Initiative
- National Heart, Lung, and Blood Institute, Diseases and Conditions Index
- A history of electrocardiography
- Interpretation of electrocardiograms in infants and children.
- Information about home made ECGs, including open source ECG software
- remote heart rate and breathing rate monitors
- Minnesota ECG Code
- ECG Changes - General Practice Notebook
- openECGproject - help develop an open ECG soulution
|
|||||||||||||||||