Economy of the United States
| Economy of the United States | |
| Currency | United States Dollar (USD) |
|---|---|
| Fiscal year | 1 October - 30 September |
| Trade organizations | NAFTA, WTO, OECD, G-20 and others |
| Statistics | |
| GDP (PPP) | $13.81 trillion (2007)[1] |
| GDP growth | 0.7% (III qtr 2008, from year ago)[1] |
| GDP per capita | $45,850 (2007) (10th) |
| GDP by sector | agriculture (0.9%), industry (20.6%), services (78.5%) |
| Inflation (CPI) | 3.7% (Oct 2007 to Oct 2008)[2] |
| Population below poverty line |
12.5% (2007)[3] |
| Labor force | 154.5 million (includes unemployed) (May 2008)[4] |
| Labor force by occupation |
managerial and professional (35.5%), technical, sales and administrative support (24.8%), services (16.5%), manufacturing, mining, transportation, and crafts (24%), farming, forestry, and fishing (0.6%) (excludes unemployed) (2007) |
| Unemployment | 6.5% (October 2008)[5] |
| Main industries | petroleum, steel, motor vehicles, aerospace, telecommunications, chemicals, electronics, food processing, consumer goods, lumber, mining, defense |
| External | |
| Exports | $1.149 trillion f.o.b. (2007 est.) |
| Export goods | production machinery and equipment, 31.4%; industrial supplies, 27.5%; non-auto consumer goods, 12.7%; motor vehicles and parts, 10.5%; aircraft and parts, 7.6%; food, feed and beverages, 7.3%; other, 3.0%. (2007) |
| Main export partners | Canada, 21.4%; Mexico, 11.7%; China, 5.6%; Japan, 5.4%; Germany, 4.3%; United Kingdom, 4.2%. |
| Imports | $1.968 trillion c.i.f. (2007 est.) |
| Import goods | non-auto consumer goods 24.3%; production machinery and equipment, 20.7%; fuels, 19.0%; non-fuel industrial supplies, 13.5%; motor vehicles and parts, 13.2%; food, feed and beverages, 4.1%; aircraft and parts, 1.9%; other 3.3%. (2007) |
| Main import partners | China, 16.9%; Canada, 15.7%; Mexico, 10.6%; Japan, 7.4%; Germany, 4.8%. |
| Gross External Debt | $13.77 trillion (30 June 2008) |
| Public finances | |
| Public debt | $10.53 trillion (October 2008)[6] 73% of GDP |
| Revenues | $2.523 trillion (2008)[7] |
| Expenses | $3.150 trillion (2008)[7][8] |
| Economic aid | ODA $19 billion, 0.2% of GDP (2004)[9] |
| Main data source: CIA World Factbook All values, unless otherwise stated, are in US dollars |
|
The economy of the United States is the largest national economy in the world.[10] Its gross domestic product (GDP) was estimated as $13.8 trillion in 2007.[11] The U.S. economy maintains a high level of output per person (GDP per capita, $46,000 in 2007, ranked at around number ten in the world). The U.S. economy has maintained a stable overall GDP growth rate, a low unemployment rate, and high levels of research and capital investment funded by both national and, because of decreasing saving rates, increasingly by foreign investors. In 2008, seventy-two percent of the economic activity in the U.S. came from consumers.[12]
Major economic concerns in the U.S. include national debt, external debt, entitlement liabilities for retiring baby boomers who have already begun withdrawing from their Social Security accounts, corporate debt, mortgage debt, a low savings rate, falling house prices, and a large current account deficit. As of June 2008, the gross U.S. external debt was over $13 trillion,[13] the most external debt of all countries in the world.[14] The 2007 estimate of the United States public debt was 65% of GDP.[15] As of October 1, 2008, the total U.S. federal debt exceeded $10 trillion,[16] about $31,700 per capita. Including unfunded Medicaid, Social Security, Medicare, and similar promised obligations, the government liabilities rise to a total of $59.1 trillion, or $516,348 per household.[17]
Contents |
History
The economic history of the United States has its roots in European settlements in the 16th, 17th, and 18th centuries. The American colonies progressed from marginally successful colonial economies to a small, independent farming economy, which in 1776 became the United States of America. In 230 years the United States grew to a huge, integrated, industrialized economy that makes up over a quarter of the world economy. The main causes were a large unified market, a supportive political-legal system, vast areas of highly productive farmlands, vast natural resources (especially timber, coal and oil), and an entrepreneurial spirit and commitment to investing in material and human capital. The economy has maintained high wages, attracting immigrants by the millions from all over the world.
After The Great Depression
For many years following the Great Depression of the 1930s, when the danger of recession appeared most serious, government sought to strengthen the economy by spending heavily itself or cutting taxes so that consumers would spend more, and by fostering rapid growth in the money supply, which also encouraged more spending. In the 1970s, economic woes brought on by the costs of the Vietnam conflict, major price increases, particularly for energy, created a strong fear of inflation. As a result, government leaders came to concentrate more on controlling inflation than on combating recession by limiting spending, resisting tax cuts, and reining in growth in the money supply.
Ideas about the best tools for stabilizing the economy changed substantially between the 1960s and the 1990s. In the 1960s, government had great faith in fiscal policy—manipulation of government revenues to influence the economy. Since spending and taxes are controlled by the president and the U.S. Congress, these elected officials played a leading role in directing the economy. A period of high inflation, high unemployment, and huge government deficits weakened confidence in fiscal policy as a tool for regulating the overall pace of economic activity. Instead, monetary policy assumed growing prominence.
Since the stagflation of the 1970s, the U.S. economy has been characterized by somewhat slower growth.
The worst recession in recent decades, in terms of lost output, occurred in the 1973-75 period of oil shocks, when GDP fell by 3.1 percent, followed by the 1981-82 recession, when GDP dropped by 2.9 percent.[18]
Since the 1970s the US has sustained trade deficits with other nations.
Output fell by 1.3 percent in the 1990-91 downturn, and a tiny 0.3 percent in the 2001 recession. The 2001 downturn lasted just eight months.[18]
In recent years, the primary economic concerns have centered on: high national debt ($9 trillion), high corporate debt ($9 trillion), high mortgage debt (over $10 trillion as of 2005 year-end), high unfunded Medicare liability ($30 trillion), high unfunded Social Security liability ($12 trillion), high external debt (amount owed to foreign lenders), high trade deficits, and a serious deterioration in the United States net international investment position (NIIP) (-24% of GDP).[19] In 2006, the U.S economy had its lowest saving rate since 1933.[20] These issues have raised concerns among economists and national politicians.[21]
The U.S. economy maintains a relatively high GDP per capita, with the caveat that it may be elevated by borrowing, a low to moderate GDP growth rate, and a low unemployment rate, making it attractive to immigrants worldwide.
Overview


A central feature of the U.S. economy is the economic freedom afforded to the private sector by allowing the private sector to make the majority of economic decisions in determining the direction and scale of what the U.S. economy produces.[22] This is enhanced by relatively low levels of regulation and government involvement,[23] as well as a court system that generally protects property rights and enforces contracts.
The United States is rich in mineral resources and fertile farm soil, and it is fortunate to have a moderate climate. It also has extensive coastlines on both the Atlantic and Pacific Oceans, as well as on the Gulf of Mexico. Rivers flow from far within the continent, and the Great Lakes—five large, inland lakes along the U.S. border with Canada—provide additional shipping access. These extensive waterways have helped shape the country's economic growth over the years and helped bind America's 50 individual states together in a single economic unit. [24]
The number of available workers and, more importantly, their productivity help determine the health of the U.S. economy. Throughout its history, the United States has experienced steady growth in the labor force, a phenomenon both cause and effect of almost constant economic expansion. Until shortly after World War I, most workers were immigrants from Europe, their immediate descendants, or African Americans who were mostly slaves taken from Africa, or slave descendants. Beginning in the early 20th century, many Latin Americans immigrated; followed by large numbers of Asians following removal of nation-origin based immigration quotas. The promise of high wages brings many highly skilled workers from around the world to the United States.
Labor mobility has also been important to the capacity of the American economy to adapt to changing conditions. When immigrants flooded labor markets on the East Coast, many workers moved inland, often to farmland waiting to be tilled. Similarly, economic opportunities in industrial, northern cities attracted black Americans from southern farms in the first half of the 20th century.
In the United States, the corporation has emerged as an association of owners, known as stockholders, who form a business enterprise governed by a complex set of rules and customs. Brought on by the process of mass production, corporations, such as General Electric, have been instrumental in shaping the United States. Through the stock market, American banks and investors have grown their economy by investing and withdrawing capital from profitable corporations. Today in the era of globalization American investors and corporations have influence all over the world. The American government has also been instrumental in investing in the economy, in areas such as providing cheap electricity (such as from the Hoover Dam), and military contracts in times of war.
While consumers and producers make most decisions that mold the economy, government has a powerful effect on the U.S. economy in at least four areas. Strong government regulation in the U.S. economy started in the early 1900s with the rise of the Progressive Movement; prior to this the government promoted economic growth through protective tariffs and subsidies to industry, built infrastructure, and established banking policies, including the gold standard, to encourage savings and investment in productive enterprises.
Government intervention
Regulation and control
The U.S. federal government regulates private enterprise in numerous ways. Regulation falls into two general categories.
Economic regulation
Some efforts seek, either directly or indirectly, to control prices. Traditionally, the government has sought to prevent monopolies such as electric utilities from raising prices beyond the level that would ensure them extremely large profits. At times, the government has extended economic control to other kinds of industries as well. In the years following the Great Depression, it devised a complex system to stabilize prices for agricultural goods, which tend to fluctuate wildly in response to rapidly changing supply and demand. A number of other industries—trucking and, later, airlines—successfully sought regulation themselves to limit what they considered as harmful price cutting.
Another form of economic regulation, antitrust law, seeks to strengthen market forces so that direct regulation is unnecessary. The government—and, sometimes, private parties—have used antitrust law to prohibit practices or mergers that would unduly limit competition.
Bank regulation in the United States is highly fragmented compared to other G10 countries where most countries have only one bank regulator. In the U.S., banking is regulated at both the federal and state level. The U.S also has one of the most highly regulated banking environments in the world; however, many of the regulations are not safety and soundness related, but are instead focused on privacy, disclosure, fraud prevention, anti-money laundering, anti-terrorism, anti-usury lending, and promoting lending to lower-income segments.
Monetary policy

The federal government attempts to use both monetary policy (control of the money supply through mechanisms such as changes in interest rates) and fiscal policy (taxes and spending) to maintain low inflation, high economic growth, and low unemployment. A relatively independent central bank, known as the Federal Reserve, was formed in 1913 to provide a stable currency and monetary policy. The U.S. dollar has been regarded as one of the most stable currencies in the world and many nations back their own currency with U.S. dollar reserves. During the last few years, the U.S. dollar has gradually depreciated in value and its reserve currency status is no longer as high as previously.
The dollar used gold standard and/or silver standard from 1785 until 1975, when it became a fiat currency.
Money supply

The most common measures are named M0 (narrowest), M1, M2, and M3. In the United States they are defined by the Federal Reserve as follows:
- M0: The total of all physical currency, plus accounts at the central bank that can be exchanged for physical currency.
- M1: M0 - those portions of M0 held as reserves or vault cash + the amount in demand accounts ("checking" or "current" accounts).
- M2: M1 + most savings accounts, money market accounts, and small denomination time deposits (certificates of deposit of under $100,000).
- M3: M2 + all other CDs, deposits of eurodollars and repurchase agreements.
The Federal Reserve ceased publishing M3 statistics in March 2006, explaining that it costs a lot to collect the data but does not provide significantly useful information.[25] They still release all the separate statistics needed to calculate M3 manually and it would cost them basically nothing to release M3 statistics. The other three money supply measures continue to be provided in detail.
Social regulations
Since the 1970s, government has also exercised control over private companies to achieve social goals, such as improving the public's health and safety or maintaining a healthy environment. For example, the Occupational Safety and Health Administration provides and enforces standards for workplace safety, and in the case of the United States Environmental Protection Agency provides standards and regulations to maintain air, water, and land resources. The U.S. Food and Drug Administration regulates what drugs may reach the market, and also provides standards of disclosure for food products.
American attitudes about regulation changed substantially during the final three decades of the 20th century. Beginning in the 1970s, policy makers grew increasingly concerned that economic regulation protected inefficient companies at the expense of consumers in industries such as airlines and trucking. At the same time, technological changes spawned new competitors in some industries, such as telecommunications, that once were considered natural monopolies. Both developments led to a succession of laws easing regulation.
While leaders of America's two most influential political parties generally favored economic deregulation during the 1970s, 1980s, and 1990s, there was less agreement concerning regulations designed to achieve social goals. Social regulation had assumed growing importance in the years following the Depression and World War II, and again in the 1960s and 1970s. During the 1980s, the government relaxed labor, consumer and environmental rules based on the idea that such regulation interfered with free enterprise, increased the costs of doing business, and thus contributed to inflation. The response to such changes is mixed; many Americans continued to voice concerns about specific events or trends, prompting the government to issue new regulations in some areas, including environmental protection.
Where legislative channels have been unresponsive, some citizens have turned to the courts to address social issues more quickly. For instance, in the 1990s, individuals, and eventually the government itself, sued tobacco companies over the health risks of cigarette smoking. The 1998 Tobacco Master Settlement Agreement provided states with long-term payments to cover medical costs to treat smoking-related illnesses.
Direct services
Each level of government provides many direct services. The federal government, for example, is responsible for national defense, backs research that often leads to the development of new products, conducts space exploration, and runs numerous programs designed to help workers develop workplace skills and find jobs (including higher education). Government spending has a significant effect on local and regional economies—and even on the overall pace of economic activity.
State governments, meanwhile, are responsible for the construction and maintenance of most highways. State, county, or city governments play the leading role in financing and operating public schools. Local governments are primarily responsible for police and fire protection.
Overall, federal, state, and local spending accounted for almost 28% of gross domestic product in 1998.[26]
Direct assistance
Government also provides many kinds of help to businesses and individuals. It offers low-interest loans and technical assistance to small businesses, and it provides loans to help students attend college. Government-sponsored enterprises buy home mortgages from lenders and turn them into securities that can be bought and sold by investors, thereby encouraging home lending. Government also actively promotes exports and seeks to prevent foreign countries from maintaining trade barriers that restrict imports.
Social Security, which is financed by a tax on employers and employees, accounts for the largest portion of Americans' retirement income. The Medicare program pays for many of the medical costs of the elderly. The Medicaid program finances medical care for low-income families. In many states, government maintains institutions for the mentally ill or people with severe disabilities. The federal government provides food stamps to help poor families obtain food, and the federal and state governments jointly provide welfare grants to support low-income parents with children.
Many of these programs, including Social Security, trace their roots to the New Deal programs of Franklin D. Roosevelt, who served as the U.S. president from 1933 to 1945.
Many other assistance programs for individuals and families, including Medicare and Medicaid, were begun in the 1960s during President Lyndon Johnson's (1963–1969) War on Poverty. Although some of these programs encountered financial difficulties in the 1990s and various reforms were proposed, they continued to have strong support from both of the United States' major political parties. Critics argued, however, that providing welfare to unemployed but healthy individuals actually created dependency rather than solving problems. Welfare reform legislation (the Personal Responsibility and Work Opportunity Act) passed in 1996 under President Bill Clinton (1993–2001) and a Republican Congress requires people to work, job search, enter training, or receive education as a condition of receiving benefits and imposes federal limits on how long individuals may receive payments (states may adopt stronger limits).
National budget
National debt
As of January 2, 2008, the total U.S. federal debt was approximately $9.20 trillion, or about $79,000 on average for each of the 117 million American taxpayers. The borrowing cap debt ceiling as of 2005 stood at $8.18 trillion.[27] In March 2006, Congress raised that ceiling an additional $0.79 trillion to $8.97 trillion, which is approximately 68% of GDP.[28] Congress has used this method to deal with an encroaching debt ceiling in previous years, as the federal borrowing limit was raised in 2002 and 2003.[29]
As of October 4, 2008, the "The Emergency Economic Stabilization Act of 2008" raises the current debt ceiling to US$ 11.3 trillion.[30]
While the U.S. national debt is the world's largest in absolute size, another measure is that of its size relative to the nation's GDP. When the national debt is put into this perspective it appears considerably less today than in past years, particularly during World War II. By this measure, it is also considerably less than those of other industrialized nations such as Japan and roughly equivalent to those of several western European nations.[31]
Sectors

Sales per sector compared to employees per sector in the United States economy in the year 2002
|

Sectors of the US economy ranked by number of sales, receipts, or shipments in the year 2002. Includes both employers and nonemployers
|
- Sectors of the U.S. Economy in 2002 - firms with payroll - All Sector Totals[32]
| Sector | Establishments | Sales, receipts, or shipments ($1,000) |
Annual payroll ($1,000) |
Paid employees |
|---|---|---|---|---|
| Mining | 24,087 | 182,911,093 | 21,173,895 | 477,840 |
| Utilities | 17,103 | 398,907,044 | 42,417,830 | 663,044 |
| Construction | 710,307 | 1,196,555,587 | 254,292,144 | 7,193,069 |
| Manufacturing | 350,828 | 3,916,136,712 | 576,170,541 | 14,699,536 |
| Wholesale trade | 435,521 | 4,634,755,112 | 259,653,080 | 5,878,405 |
| Retail trade | 1,114,637 | 3,056,421,997 | 302,113,581 | 14,647,675 |
| Transportation & warehousing | 199,618 | 382,152,040 | 115,988,733 | 3,650,859 |
| Information | 137,678 | 891,845,956 | 194,670,163 | 3,736,061 |
| Finance & insurance | 440,268 | 2,803,854,868 | 377,790,172 | 6,578,817 |
| Real estate & rental & leasing | 322,815 | 335,587,706 | 60,222,584 | 1,948,657 |
| Professional, scientific, & technical services | 771,305 | 886,801,038 | 376,090,052 | 7,243,505 |
| Management of companies & enterprises | 49,308 | 107,064,264 | 178,996,060 | 2,605,292 |
| Administrative & support & waste management & remediation service | 350,583 | 432,577,580 | 206,439,329 | 8,741,854 |
| Educational services | 49,319 | 30,690,707 | 10,164,378 | 430,164 |
| Health care & social assistance | 704,526 | 1,207,299,734 | 495,845,829 | 15,052,255 |
| Arts, entertainment, & recreation | 110,313 | 141,904,109 | 45,169,117 | 1,848,674 |
| Accommodation & food services | 565,590 | 449,498,718 | 127,554,483 | 10,120,951 |
| Other services (except public administration) | 537,576 | 307,049,461 | 82,954,939 | 3,475,310 |
| Totals | 6,891,382 | 21,362,013,726 | 3,727,706,910 | 108,991,968 |
Industrial production growth rate: 3.2% (2005 est.)
Electricity:
- production: 3.979 trillion kWh (2004)
- consumption: 3.717 trillion kWh (2004)
- exports: 22.9 billion kWh (2004)
- imports: 34.21 billion kWh (2004)
Electricity - production by source:
- fossil fuel: 71.6%
- hydro: 5.6%
- nuclear: 20.6%
- other: 2.3% (2001)
Oil:
- production: 7.61 million barrel/day (2005 est.)
- consumption: 20.03 million barrel/day (2003 est.)
- exports: 1.048 million barrel/day (2004 est.)
- imports: 13.15 million barrel/day (2004 est.)
- net imports: 12.097 million barrel/day (2004 est.)
- proved reserves: 22.45 billion barrel (1 January 2002)
Natural gas:
- production: 531.1 billion cu m (2004 est.)
- consumption: 635.1 billion cu m (2004 est.)
- exports: 24.18 billion cu m (2004 est.)
- imports: 120.6 billion cu m (2004 est.)
- proved reserves: 5.451 trillion cu m (1 January 2005 est.)
Agriculture - products: wheat, corn, other grains, fruits, vegetables, cotton; beef, pork, poultry, dairy products; forest products; fish
Exports - commodities: capital goods, automobiles, industrial supplies and raw materials, consumer goods, agricultural products
Imports - commodities: crude oil and refined petroleum products, machinery, automobiles, consumer goods, industrial raw materials, food and beverages
Agriculture
- Further information: United States Department of Agriculture
Agriculture is a major industry in the United States and the country is a net exporter of food.
Manufacturing
USA is a leading manufacturing power in the world with a yearly industrial output 2,696,880 millions of US Dollars (data for January 2008). The US manufacturing is highly diversified and technologically advanced. Main industries are petroleum, steel, motor vehicles, aerospace, telecommunications, chemicals, electronics, food processing, consumer goods, lumber, mining.
Financial

International trade
External debt: Liabilities to foreigners

Gross U.S. liabilities to foreigners are $16.3 trillion as of the end of 2006 (over 100% of GDP). The U.S. Net International Investment Position (NIIP)[34] deteriorated to a negative $2.5 trillion at the end of 2006,[35] or about minus 19% of GDP.
This figure rises as long as the US maintains an imbalance in trade, specifically, when the value of imports substantially outweighs the value of exports. It should be noted that this external debt does not, for the most part, represent lending to Americans or the American government, nor is it consumer debt owed to non-US creditors. Rather, the external debt is an accounting entry that largely represents US domestic assets purchased with trade dollars and owned overseas, largely by US trading partners.[36] However, this is not the whole picture, as foreign holdings of government debt currently amount to about 27% of the total, or some 2 trillion dollars.[37]
For countries like the United States, a large net external debt is created when the value of foreign assets (debt and equity) held by domestic residents is less than the value of domestic assets held by foreigners. In simple terms, as foreigners buy property in the US, this adds to the external debt. When this occurs in greater amounts than Americans buying property overseas, nations like the United States are said to be debtor nations, but this is not conventional debt like a loan obtained from a bank.[34] However, foreigners also purchase U.S. debt instruments, such as government bonds, which are forms of conventional debt.
If the external debt represents foreign ownership of domestic assets, the result is that rental income, stock dividends, capital gains and other investment income is received by foreign investors, rather than by US residents. On the other hand, when US debt is held by overseas investors, they receive interest and principal repayments. As the trade imbalance puts extra dollars in hands outside of the US, these dollars may be used to invest in new assets (foreign direct investment, such as new plants) or be used to buy existing US assets such as stocks, real estate and bonds. With a mounting trade deficit, the income from these assets increasingly transfers overseas.
Of major concern is the fact that the magnitude of the NIIP (or net external debt) is quite a bit larger than most national economies. Fueled by the sizable trade deficit, the external debt is so large that many wonder if the trade situation can be sustained in the long term. Complicating the matter is that many of America's trading partners, such as China, depend for much of their entire economy on exports, and especially exports to America. Many controversies exist about the current trade and external debt situation, and it is arguable whether anyone understands how these dynamics will play out in a historically unprecedented floating exchange rate system. While various aspects of the U.S. economic profile have precedents in the situations of other countries (notably government debt as a percentage of GDP), the sheer size of the US, and the integral role of the US economy in the overall global economic environment, create considerable uncertainty about the future.
This enormous inflow of capital from China is one of the root causes of the financial crisis engulfing the US as of September 2008: China has been buying huge quantities of dollar assets in order to keep its currency undervalued and its export economy humming, which has caused US interest rates and saving rates to stay artificially low for too long. These low interests, in turn, created the housing bubble (when interests are low, people can afford more expensive houses while keeping their monthly mortgage payments the same), whose collapse has caused the recent turmoil in the financial markets worldwide. Leading economists such as Larry Summers (former Treasury Secretary under Clinton) and Paul Krugman had been warning about this pernicious cycle since the mid-2000s.[38][39]
Trade agreements

- Further information: United States Court of International Trade, Canada-United States Free Trade Agreement, United States International Trade Commission, United States free trade agreements, North American Free Trade Agreement, Organization of American States, and Security and Prosperity Partnership of North America
The U.S. is a member of several international trade organizations. The purpose of joining these organizations is to come to agreement with other nations on trade issues, although there is some disagreement among U.S. citizens as to whether or not the U.S. government should be making these trade agreements in the first place.
Imports and exports
The United States is the most significant nation in the world when it comes to international trade. For decades, it has led the world in imports while simultaneously remaining as one of the top three exporters of the world.
As the major epicenter of world trade, the United States enjoys leverage that many other nations do not. For one, since it is the world's leading consumer, it is the number one customer of companies all around the world. Many businesses compete for a share of the United States market. In addition, the United States occasionally uses its economic leverage to impose economic sanctions in different regions of the world. USA is the top export market for almost 60 trading nations worldwide.
Since it is the world's leading importer, there are many U.S. dollars in circulation all around the planet. The stable U.S. economy and fairly sound monetary policy has led to faith in the U.S. dollar as the world's most stable currency.
In order to fund the national debt (also known as public debt), the United States relies on selling U.S. treasury bonds to people both inside and outside the country, and in recent times the latter have become increasingly important. Much of the money generated for the treasury bonds came from U.S. dollars which were used to purchase imports in the United States.
US trade by nation
| US trade of goods by nation in 2004 (services not included) | |||||||
|---|---|---|---|---|---|---|---|
| Exports[40] | Imports[41] | ||||||
| Nation | Millions of dollars | Percentage | Cumulative Percentage | Nation | Millions of dollars | Percentage | Cumulative Percentage |
| Canada | 189,101 | 23.12% | 23.12% | Canada | 255,928 | 17.41% | 17.41% |
| Mexico | 110,775 | 13.54% | 36.66% | China | 196,699 | 13.38% | 30.80% |
| Japan | 54,400 | 6.65% | 43.31% | Mexico | 155,843 | 10.60% | 41.40% |
| United Kingdom | 35,960 | 4.40% | 47.71% | Japan | 129,595 | 8.82% | 50.22% |
| China | 34,721 | 4.24% | 51.95% | Germany | 77,236 | 5.26% | 55.48% |
| Germany | 31,381 | 3.84% | 55.79% | United Kingdom | 46,402 | 3.16% | 58.63% |
| South Korea | 26,333 | 3.22% | 59.01% | South Korea | 46,163 | 3.14% | 61.77% |
| Netherlands | 24,286 | 2.97% | 61.98% | Taiwan, ROC | 34,617 | 2.36% | 64.13% |
| Taiwan | 21,731 | 2.66% | 64.64% | France | 31,814 | 2.16% | 66.29% |
| France | 21,240 | 2.60% | 67.23% | Malaysia | 28,185 | 1.92% | 68.21% |
| Singapore | 19,601 | 2.40% | 69.63% | Italy | 28,089 | 1.91% | 70.12% |
| Belgium | 16,877 | 2.06% | 71.69% | Ireland | 27,442 | 1.87% | 71.99% |
| Hong Kong | 15,809 | 1.93% | 73.63% | Venezuela | 24,962 | 1.70% | 73.69% |
| 14,271 | 1.74% | 75.37% | 21,157 | 1.44% | 75.13% | ||
| 13,863 | 1.69% | 77.07% | 20,924 | 1.42% | 76.55% | ||
| 10,897 | 1.33% | 78.40% | 17,577 | 1.20% | 77.75% | ||
| 10,711 | 1.31% | 79.71% | 16,246 | 1.11% | 78.85% | ||
| 9,268 | 1.13% | 80.84% | 15,562 | 1.06% | 79.91% | ||
| 9,198 | 1.12% | 81.96% | 15,306 | 1.04% | 80.95% | ||
| 8,166 | 1.00% | 82.96% | 14,527 | 0.99% | 81.94% | ||
| 7,072 | 0.86% | 83.83% | 12,687 | 0.86% | 82.81% | ||
| 6,641 | 0.81% | 84.64% | 12,605 | 0.86% | 83.66% | ||
| 6,363 | 0.78% | 85.42% | 12,448 | 0.85% | 84.51% | ||
| 12,095 | 1.55% | 86.16% | 11,847 | 0.81% | 85.32% | ||
| 5,245 | 0.64% | 86.80% | 11,643 | 0.79% | 86.11% | ||
| 4,782 | 0.58% | 87.39% | 10,811 | 0.74% | 86.84% | ||
| 4,504 | 0.55% | 87.94% | 9,314 | 0.63% | 87.48% | ||
| 4,343 | 0.53% | 88.47% | 9,144 | 0.62% | 88.10% | ||
| 4,064 | 0.50% | 88.97% | 8,514 | 0.58% | 88.68% | ||
| 3,625 | 0.44% | 89.41% | 7,544 | 0.51% | 89.19% | ||
| 3,386 | 0.41% | 89.82% | 7,476 | 0.51% | 89.70% | ||
| 3,361 | 0.41% | 90.24% | 7,409 | 0.50% | 90.21% | ||
| 3,304 | 0.40% | 90.64% | 7,290 | 0.50% | 90.70% | ||
| 3,265 | 0.40% | 91.04% | |||||
| 3,172 | 0.39% | 91.43% | |||||
| 3,105 | 0.38% | 91.81% | |||||
| Others | 67,023 | 8.19% | 100.00% | Others | 136,661 | 9.30% | 100.00% |
| Total Exports: | 817,939 | Total Imports: | 1,469,667 | ||||
Wealth
Distribution of wealth

Poverty
There is significant disagreement about poverty in the United States, particularly over how poverty ought to be defined. Using radically different definitions, two major groups of advocates have claimed variously that (a) the United States has eliminated poverty over the last century;[42] or (b) it has such a severe poverty crisis that it ought to devote significantly more resources to the problem. The debate includes how poverty should be defined.
Measures of poverty can be either absolute or relative. Absolute poverty is defined in real dollar values, whereas relative poverty is a comparison of the highest to the lowest standard of living at a particular time period.
Private income
| Median income levels | |||||||||
|---|---|---|---|---|---|---|---|---|---|
| Households | Persons, age 25 or older with earnings | Household income by race | |||||||
| All households | Dual earner households |
Per household member |
Males | Females | Both sexes | Asian | White, non-hispanic |
Hispanic | Black |
| $46,326 | $67,348 | $23,535 | $39,403 | $26,507 | $32,140 | $57,518 | $48,977 | $34,241 | $30,134 |
| Median personal income by educational attainment | |||||||||
| Measure | Some High School | High school graduate | Some college | Associate degree | Bachelor's degree or higher | Bachelor's degree | Master's degree | Professional degree | Doctorate degree |
| Persons, age 25+ w/ earnings | $20,321 | $26,505 | $31,054 | $35,009 | $49,303 | $43,143 | $52,390 | $82,473 | $70,853 |
| Male, age 25+ w/ earnings | $24,192 | $32,085 | $39,150 | $42,382 | $60,493 | $52,265 | $67,123 | $100,000 | $78,324 |
| Female, age 25+ w/ earnings | $15,073 | $21,117 | $25,185 | $29,510 | $40,483 | $36,532 | $45,730 | $66,055 | $54,666 |
| Persons, age 25+, employed full-time | $25,039 | $31,539 | $37,135 | $40,588 | $56,078 | $50,944 | $61,273 | $100,000 | $79,401 |
| Household | $22,718 | $36,835 | $45,854 | $51,970 | $73,446 | $68,728 | $78,541 | $100,000 | $96,830 |
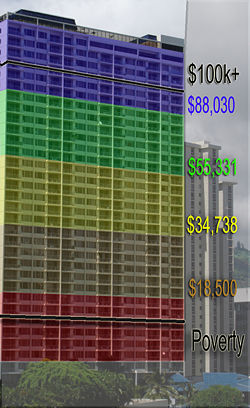
| Household income distribution | |||||||||
| Bottom 10% | Bottom 20% | Bottom 25% | Middle 33% | Middle 20% | Top 25% | Top 20% | Top 5% | Top 1.5% | Top 1% |
| $0 to $10,500 | $0 to $18,500 | $0 to $22,500 | $30,000 to $62,500 | $35,000 to $55,000 | $77,500 and up | $92,000 and up | $167,000 and up | $250,000 and up | $350,000 and up |
| SOURCE: US Census Bureau, 2006; income statistics for the year 2005 | |||||||||
Distribution of income

Income inequality
The United Nations Development Programme Report 2006 on income equality ranks the United States as tied for 73rd out of 126 countries, as measured by the Gini coefficient. (See List of countries by income equality.) The Gini coefficient for the U.S. was 45 in 2007, according to the CIA. The richest 10% make 16 times as much as the poorest 10%, and the richest 20% make 8 times as much as the poorest 20%. (See List of countries by income equality.)
International comparison
| Country | Median household income national currency units | Year | PPP rate (OECD) | Median household income (PPP) |
|---|---|---|---|---|
| Switzerland[43] | 95,184 CHF | 2005 | 1.74 | $55,000 |
| California, US[44] | US State | $54,000 | ||
| United States | 48,000 USD | 2006 | 1.00 | $48,000 |
| Canada [45] | 53,634 CAD | 2005 | 1.21 | $44,000 |
| New Zealand [46] | 62,556 NZD | 2007 | 1.54 | $41,000 |
| United Kingdom [47] | 24,700 GBP | 2004 | 0.632 | $39,000 |
| Australia[48] | 53,404 AUD | 2006 | 1.41 | $38,000 |
| Israel[49] | 107,820 ILS | 2006 | 2.90 | $37,000 |
| Ireland | 35,410 EUR | 2005 | 1.02 | $35,000 |
| Scotland, United Kingdom[50] |
21,892 GBP | 2005 | 0.649 | $34,000 |
| West Virginia, US[51] | US state | $33,000 | ||
| Hong Kong[52] | 186,000 HKD | 2005 | 5.96 | $31,000 |
| Singapore[53] | 45,960 SGD | 2005 | 1.55 | $30,000 |
Unemployment


January 2008 the unemployment rate for adult men were 4.4%, adult women 4.2%, and 18% for teenagers.
November 2008 the unemployment rate rose to its highest level since 1994 in October, reaching 6.5%.[54]
The effect of military expenditure

Most economic models have shown that military spending by the United States Government has diverted resources from productive uses such as consumption and investment, which has ultimately slowed growth and reduced employment.[55] Conservative estimates project that by 2017 the Iraq and Afghan wars will have cost the U.S. budget between $1.7 trillion and $2.7 trillion. Interest on money borrowed to pay those costs could alone add a further $816 billion to that bottom line. Nobel Prize-winning economist Joseph E. Stiglitz even says that estimating all economic and social costs might push the U.S. war bill up toward $5 trillion by 2017. This figure includes the cost to the U.S. economy of global oil prices that have quadrupled since 2003, an increase blamed partly on the Iraq war.[56]
Proponents of the military actions of the United States reference the cost of the wars as a percent of national GDP. With a military budget of 4.06% of GDP,[57] the relative cost and impact to the economy is far less than at nearly any other time in the last 60 years. With a military expenses topping at 37.8% of GDP in 1944 and 6.2% of GDP in 1986; with a low point of 3.0% in 2000, prior to the attacks of September 11, 2001. [58]
Economic predictions and forecasting
all the peop;e wil be charge 10 million a monthGlobal Insight, and the UCLA Anderson Forecast. Various state agencies, including the California Department of Finance, also make predictions.
Other statistics
Historic exchange rates:
-
Jan 2008 Jan 2007 Jan 2006 Jan 2005 Jan 2004 Jan 2003 Jan 2002 2001* 2000* 1999* 1998 1997 Canadian dollars per U.S. dollar 0.982 1.165 1.164 1.204 1.293 1.576 1.600 1.548 1.485 1.485 1.483 1.384 Japanese yen per U.S. dollar 112.1 119.0 118.1 102.5 107.2 118.7 132.6 121.5 107.7 113.9 130.9 120.9 Euros per US dollar 0.6803 0.7577 0.8444 0.7387 0.7939 0.9534 1.128 1.062 0.9947 0.8557 - - British pounds per U.S. dollar 0.5009 0.5104 0.5812 0.5209 0.5600 0.6212 0.6981 0.6944 0.6596 0.6180 0.6037 0.6106 Chinese renminbi[59] per U.S. dollar 7.3141 7.8175 8.0755 8.2865 8.2867 8.2871 8.2867 8.2782 8.2803 8.2789 8.2796 8.2982 French francs per U.S. dollar - - - - - - - - - 5.65 5.899 5.836 Italian lire per U.S. dollar - - - - - - - - - 1,668.7 1,763.2 1,703.1 German deutschmarks per U.S. dollar - - - - - - - - - 1.69 1.969 1.734 Note: financial institutions in France, Italy, Germany, and eight other European countries started using the euro on 1 January 1999, with the euro replacing the local currency for all transactions in 2002. Their 1999 figures are for January. *January 1 exchange rates
See also
- Income in the United States
- Household income in the United States
- Personal income in the United States
- Income inequality in the United States
- Affluence in the United States
- Wealth in the United States
- American Dream
- Balance of payments
- Economy of Puerto Rico
- American trade
- List of United States companies
- National debt by U.S. presidential terms - Includes federal spending and GDP
- Economic history of the United States
- Energy policy of the United States
- List of industry trade groups in the United States
- Subprime mortgage crisis
- Oil price increases since 2003
- Economic crisis of 2008
- Proposed bailout of U.S. financial system (2008)
- United States federal budget
References
- ↑ 1.0 1.1 "National Economic Accounts". BEA. Retrieved on 2008-11-17.
- ↑ "Consumer Price Index Summary". Bureau of Labor Statistics (September 2008). Retrieved on 2008-11-17.
- ↑ "Poverty". Census Bureau. Retrieved on 2008-11-17.
- ↑ "Employment Situation OCTOBER 2008". Bureau of Labor Statistics (November 7, 2008). Retrieved on 2008-11-17.
- ↑ "Bureau of Labor Statistics Employment Situation Summary". U.S. Dept. of Labor. Retrieved on 2008-11-07.
- ↑ "The Debt to the Penny". Treasury Department. Retrieved on 2008-11-17.
- ↑ 7.0 7.1 "Monthly Budget Review". CBO (October 7, 2008). Retrieved on 2008-11-17.
- ↑ "Letter to Chairman". CBO (February 11, 2008). Retrieved on 2008-11-17.
- ↑ "Biggest donors by GDP", BBC News. Retrieved on 2008-11-17.
- ↑ "Rank Order - GDP (purchasing power parity)". CIA. Retrieved on 2008-09-21.
- ↑ "National Economic Accounts: Gross Domestic Product (GDP) "Current-dollar and 'real' GDP"". Bureau of Economic Analysis. Retrieved on 2008-02-21.
- ↑ Can the World Stop the Slide, TIME, February 4, 2008, page 27.
- ↑ "United States Department of the Treasury".
- ↑ "CIA World Factbook 2007".
- ↑ US spends its way to 28 Eiffel towers: made out of pure gold, Times Online
- ↑ "TreasuryDirect". Treasurydirect.gov. Retrieved on 2008-11-17.
- ↑ "Taxpayers on the hook for $59 trillion", USA Today (2007-05-29).
- ↑ 18.0 18.1 "Worries grow of deeper U.S. recession", CNN.com. Retrieved on 2008-11-17.
- ↑ Bivens, L. Josh (December 14, 2004). Debt and the dollar Economic Policy Institute. Retrieved on July 8, 2007.
- ↑ Associated Press (January 30, 2006).US savings rate hits lowest level since 1933MSNBC. Retrieved on May 6, 2007.
- ↑ Cauchon, Dennis and John Waggoner (October 3, 2004).The Looming National Benefit Crisis. USA Today
- ↑ "Index of Economic Freedom - United States". Heritage.org. Retrieved on 2008-11-17.
- ↑ Anderson, Jack (2006-05-22). "Tax Misery & Reform Index", Forbes.com. Retrieved on 2008-11-17.
- ↑ U.S. Department of state:How the U.S. Economy Works Retrieved December 1, 2008
- ↑ "Discontinuance of M3".
- ↑ "U.S. Budget 2001".
- ↑ "MSNBC".
- ↑ "Bloomberg".
- ↑ "Washington Post 29 December 2005".
- ↑ Zeng, Min (OCTOBER 6, 2008). "Bailout Funding Promises To Pressure Treasury Prices", WSJ.com. Retrieved on 2008-11-17.
- ↑ National Debt Burden : Full Histoyr
- ↑ 2002 Economic Census - Summary Statistics by 2002 NAICS: http://www.census.gov/econ/census02/data/us/US000.HTM
- ↑ Current account balance, U.S. dollars, Billions from IMF World Economic Outlook Database, April 2008
- ↑ 34.0 34.1 Chapter 5-10: The International Investment Position. International Finance Theory and Policy. 6/3/2004. http://internationalecon.com/v1.0/Finance/ch5/5c100.html. Retrieved on 2008-11-17.
- ↑ "News Release: U.S. International Investment Position, 2006". BEA (June 28, 2007). Retrieved on 2008-11-17.
- ↑ Bivens, L. Josh (December 14, 2004). "Debt and the dollar: The United States damages future living standards by borrowing itself into a deceptively deep hole". Epinet.org. Retrieved on 2008-11-17.
- ↑
- ↑ "Reflections on Global Account Imbalances and Emerging Markets Reserve Accumulation" www.president.harvard.edu/speeches/2006/0324_rbi.htmlLawrence H. Summers, speech at The Reserve Bank of India, Mumbai, India, March 24, 2006
- ↑ "The Chinese Connection" www.pkarchive.org/column/052005.htmlby Paul Krugman, originally published in May 20, 20004 in The New York Times.
- ↑ http://www.ita.doc.gov/td/industry/OTEA/usfth/aggregate/H04t55.pdf
- ↑ http://www.ita.doc.gov/td/industry/otea/usfth/aggregate/H04t56.pdf
- ↑ "Understanding Poverty in America".
- ↑ "Swiss Government, income quintiles, 2005". Retrieved on 2007-01-19.
- ↑ "California Median Household income, 2006". Retrieved on 2007-03-22.
- ↑ "Canada median household income". Retrieved on 2008-5-2.
- ↑ "New Zealand income survey showing median household income". Retrieved on 2007-10-04.
- ↑ "UK parliament discussion showing median household income". Retrieved on 2006-12-31.
- ↑ "Census QuickStats". Retrieved on 2007-10-07.
- ↑ "israeli median household income, 2006". Retrieved on 2008-01-15.
- ↑ "Scottish Economic Statistics 2007". Retrieved on 2007-10-09.
- ↑ "West Virginia, Median Household Income, 2005". Retrieved on 2007-03-22.
- ↑ "Hong Kong median household income, 2005". Retrieved on 2007-01-19.
- ↑ "Singapore median household income, 2005". Retrieved on 2007-01-19.
- ↑ "US unemployment rate at 14-year high". RTÉ Business (November 07, 2008). Retrieved on 2008-11-17.
- ↑ The Economic Impact of the Iraq War and Higher Military Spending Dean Baker, May 2007, Center for Economic and Policy Research
- ↑ Studies: Iraq war will cost $12 billion a month updated 10:26 p.m. ET March 9, 2008
- ↑ CIA - The World Factbook updated November 6, 2008
- ↑ "Relative Size of US Military Spending, 1940–2003". TruthAndPolitics.org. Retrieved on 2008-11-17.
- ↑ "FXHistory: Historical Currency Exchange Rates".
Other references
- Bureau of Economic Analysis Historical Gross Domestic Product Estimates
- US Bureau of Labor Statistics Employment status of the civilian noninstitutional population, 1940 to date
- 2008 Poverty Guidelines US Dept of Health and Human Services
- Who Are the Real Free Traders in Congress?
External links
- CIA - The World Factbook - United States
- Outline of the U.S. Economy
- Bureau of Economic Analysis: Selected NIPA tables (Lots of U.S. economic data)
- "List of Corporate Leaders of the United States," Economic Expert
- U.S. Economic Calendar
- U.S. Census Bureau
- U.S. Dept of Labor - Bureau of Labor Statistics
- U.S. Dept of Commerce - Bureau of Economic Analysis
- FRB: Z.1 Release-- Flow of Funds Accounts of the United States, Release Dates
- OECD's United States country Web site and OECD Economic Survey of the United States
- U.S. Energy Information Administration
- National Bureau of Economic Research (USA) Economics material from the organization that declares Recessions and Recoveries.
- Bureau of Labor Statistics–from the American Labor Department
- US Department of Commerce Economics Statistics
- The Heritage Foundation: Understanding Poverty in America
- The Possible Collapse of the American Economy at 2007
- GDP growth viz Savings rate since 1985 Comparing GDP growth rate with the Savings rate since 1985
- Gross Domestic Product Growth - USA
- Unemployment Rate - USA
- Consumer Price Index - USA
- Dollars & Sense
- A U.S.-Colombia Free Trade Agreement: Strengthening Democracy and Progress in Latin America
|
|||||
|
|||||||||||||||||||||||||||||||||||||||||
|
|||||||
|
|||||
|
|||||