DNA microarray

- For terminology, see glossary below.
A DNA microarray is a multiplex technology used in molecular biology and in medicine. It consists of an arrayed series of thousands of microscopic spots of DNA oligonucleotides, called features, each containing picomoles of a specific DNA sequence. This can be a short section of a gene or other DNA element that are used as probes to hybridize a cDNA or cRNA sample (called target) under high-stringency conditions. Probe-target hybridization is usually detected and quantified by fluorescence-based detection of fluorophore-labeled targets to determine relative abundance of nucleic acid sequences in the target.
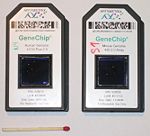
In standard microarrays, the probes are attached to a solid surface by a covalent bond to a chemical matrix (via epoxy-silane, amino-silane, lysine, polyacrylamide or others). The solid surface can be glass or a silicon chip, in which case they are commonly known as gene chip or colloquially Affy chip when an Affymetrix chip is used. Other microarray platforms, such as Illumina, use microscopic beads, instead of the large solid support. DNA arrays are different from other types of microarray only in that they either measure DNA or use DNA as part of its detection system.
DNA microarrays can be used to measure changes in expression levels, to detect single nucleotide polymorphisms (SNPs) (see Types of arrays section), in genotyping or in resquencing mutant genomes. Microarrays also differ in fabrication, workings, accuracy, efficiency, and cost (see fabrication section). Additional factors for microarray experiments are the experimental design and the methods of analyzing the data (see Bioinformatics section).
Contents |
History
Microarray technology evolved from Southern blotting, where fragmented DNA is attached to a substrate and then probed with a known gene or fragment. The use of a collection of distinct DNAs in arrays for expression profiling was first described in 1987, and the arrayed DNAs were used to identify genes whose expression is modulated by interferon.[1] These early gene arrays were made by spotting cDNAs onto filter paper with a pin-spotting device. The use of miniaturized microarrays for gene expression profiling was first reported in 1995, [2] and a complete eukaryotic genome (Saccharomyces cerevisiae) on a microarray was published in 1997. [3]
Uses and types
Arrays of DNA can be spatially arranged, as in the commonly known gene chip (also called genome chip, DNA chip or gene array), or can be specific DNA sequences labelled such that they can be independently identified in solution. The traditional solid-phase array is a collection of microscopic DNA spots attached to a solid surface, such as glass, plastic or silicon biochip. The affixed DNA segments are known as probes (although some sources use different terms such as reporters). Thousands of them can be placed in known locations on a single DNA microarray.
DNA microarrays can be used to detect DNA (as in comparative genomic hybridization), or detect RNA (most commonly as cDNA after reverse transcription) that may or may not be translated into proteins. The process of measuring gene expression via cDNA is called expression analysis or expression profiling.
Since an array can contain tens of thousands of probes, a microarray experiment can accomplish that many genetic tests in parallel. Therefore arrays have dramatically accelerated many types of investigation.
Applications include:
| Technology or Application | Synopsis |
|---|---|
| Gene expression profiling | In an mRNA or gene expression profiling experiment the expression levels of thousands of genes are simultaneously monitored to study the effects of certain treatments, diseases, and developmental stages on gene expression. For example, microarray-based gene expression profiling can be used to identify genes whose expression is changed in response to pathogens or other organisms by comparing gene expression in infected to that in uninfected cells or tissues. [4] |
| Comparative genomic hybridization | Assessing genome content in different cells or closely related organisms. [5] [6] |
| Chromatin immunoprecipitation on Chip | DNA sequences bound to a particular protein can be isolated by immunoprecipitating that protein (ChIP), these fragments can be then hybridized to a microarray (such as a tiling array) allowing the determination of protein binding site occupancy throughout the genome. Example protein to immunoprecipitate are histone modifications (H3K27me3, H3K4me2, H3K9me3, etc), Polycomb-group protein (PRC2:Suz12, PRC1:YY1) and trithorax-group protein (Ash1) to study the epigenetic landscape or RNA Polymerase II to study the transcription lanscape. |
| SNP detection | Identifying single nucleotide polymorphism among alleles within or between populations.[7] Several applications of microarrays make use of SNP detection, including Genotyping, forensic analysis, measuring predisposition to disease, identifying drug-candidates, evaluating germline mutations in individuals or somatic mutations in cancers, assessing loss of heterozygosity, or genetic linkage analysis. |
| Alternative splicing detection | An 'exon junction array design uses probes specific to the expected or potential splice sites of predicted exons for a gene. It is of intermediate density, or coverage, to a typical gene expression array (with 1-3 probes per gene) and a genomic tiling array (with hundreds or thousands of probes per gene). It is used to assay the expression of alternative splice forms of a gene. Exon arrays have a different design, employing probes designed to detect each individual exon for known or predicted genes, and can be used for detecting different splicing isoforms. |
| Tiling array | Genome tiling arrays consist of overlapping probes designed to densely represent a genomic region of interest, sometimes as large as an entire human chromosome. The purpose is to empirically detect expression of transcripts or alternatively splice forms which may not have been previously known or predicted. |
Fabrication
Microarrays can be manufactured in different ways, depending on the number of probes under examination, costs, customization requirements, and the type of scientific question being asked. Arrays may have as few as 10 probes to up to 2.1 million (NimbleGen, Roche) micrometre-scale probes from commercial vendors.
Surface engineering
The first step of DNA microarray fabrication involves surface engineering of a substrate in order to obtain desirable surface properties for the application of interest. Optimal surface properties are those which produce high signal to noise ratios for the DNA targets of interest. Generally, this involves maximizing the probe surface density and activity while minimizing the non-specific binding of the targets of interest. Methods of surface engineering vary depending on the platform material, design, and application.
Spotted vs. oligonucleotide arrays
Microarrays can be fabricated using a variety of technologies, including printing with fine-pointed pins onto glass slides, photolithography using pre-made masks, photolithography using dynamic micromirror devices, ink-jet printing, [8] or electrochemistry on microelectrode arrays.
In spotted microarrays, the probes are oligonucleotides, cDNA or small fragments of PCR products that correspond to mRNAs. The probes are synthesized prior to deposition on the array surface and are then "spotted" onto glass. A common approach utilizes an array of fine pins or needles controlled by a robotic arm that is dipped into wells containing DNA probes and then depositing each probe at designated locations on the array surface. The resulting "grid" of probes represents the nucleic acid profiles of the prepared probes and is ready to receive complementary cDNA or cRNA "targets" derived from experimental or clinical samples. This technique is used by research scientists around the world to produce "in-house" printed microarrays from their own labs. These arrays may be easily customized for each experiment, because researchers can choose the probes and printing locations on the arrays, synthesize the probes in their own lab (or collaborating facility), and spot the arrays. They can then generate their own labeled samples for hybridization, hybridize the samples to the array, and finally scan the arrays with their own equipment. This provides a relatively low-cost microarray that may be customized for each study, and avoids the costs of purchasing often more expensive commercial arrays that may represent vast numbers of genes that are not of interest to the investigator. Publications exist which indicate in-house spotted microarrays may not provide the same level of sensitivity compared to commercial oligonucleotide arrays, [9] possibly owing to the small batch sizes and reduced printing efficiencies when compared to industrial manufactures of oligo arrays.
In oligonucleotide microarrays, the probes are short sequences designed to match parts of the sequence of known or predicted open reading frames. Although oligonucleotide probes are often used in "spotted" microarrays, the term "oligonucleotide array" most often refers to a specific technique of manufacturing. Oligonucleotide arrays are produced by printing short oligonucleotide sequences designed to represent a single gene or family of gene splice-variants by synthesizing this sequence directly onto the array surface instead of depositing intact sequences. Sequences may be longer (60-mer probes such as the Agilent design) or shorter (25-mer probes produced by Affymetrix) depending on the desired purpose; longer probes are more specific to individual target genes, shorter probes may be spotted in higher density across the array and are cheaper to manufacture. One technique used to produce oligonucleotide arrays include photolithographic synthesis (Agilent and Affymetrix) on a silica substrate where light and light-sensitive masking agents are used to "build" a sequence one nucleotide at a time across the entire array. [10] Each applicable probe is selectively "unmasked" prior to bathing the array in a solution of a single nucleotide, then a masking reaction takes place and the next set of probes are unmasked in preparation for a different nucleotide exposure. After many repetitions, the sequences of every probe become fully constructed. More recently, Maskless Array Synthesis from NimbleGen Systems has combined flexibility with large numbers of probes. [11]
Two-channel vs. one-channel detection

Two-color microarrays or two-channel microarrays are typically hybridized with cDNA prepared from two samples to be compared (e.g. diseased tissue versus healthy tissue) and that are labeled with two different fluorophores. [12] Fluorescent dyes commonly used for cDNA labelling include Cy3, which has a fluorescence emission wavelength of 570 nm (corresponding to the green part of the light spectrum), and Cy5 with a fluorescence emission wavelength of 670 nm (corresponding to the red part of the light spectrum). The two Cy-labelled cDNA samples are mixed and hybridized to a single microarray that is then scanned in a microarray scanner to visualize fluorescence of the two fluorophores after excitation with a laser beam of a defined wavelength. Relative intensities of each fluorophore may then be used in ratio-based analysis to identify up-regulated and down-regulated genes. [13]
Oligonucleotide microarrays often contain control probes designed to hybridize with RNA spike-ins. The degree of hybridization between the spike-ins and the control probes is used to normalize the hybridization measurements for the target probes. Although absolute levels of gene expression may be determined in the two-color array, the relative differences in expression among different spots within a sample and between samples is the preferred method of data analysis for the two-color system. Examples of providers for such microarrays includes Agilent with their Dual-Mode platform, Eppendorf with their DualChip platform for fluorescence labeling, and TeleChem International with Arrayit.
In single-channel microarrays or one-color microarrays, the arrays are designed to give estimations of the absolute levels of gene expression. Therefore the comparison of two conditions requires two separate single-dye hybridizations. As only a single dye is used, the data collected represent absolute values of gene expression. These may be compared to other genes within a sample or to reference "normalizing" probes used to calibrate data across the entire array and across multiple arrays. Three popular single-channel systems are the Affymetrix "Gene Chip", the Applied Microarrays "CodeLink" arrays, and the Eppendorf "DualChip & Silverquant". One strength of the single-dye system lies in the fact that an aberrant sample cannot affect the raw data derived from other samples, because each array chip is exposed to only one sample (as opposed to a two-color system in which a single low-quality sample may drastically impinge on overall data precision even if the other sample was of high quality). Another benefit is that data are more easily compared to arrays from different experiments; the absolute values of gene expression may be compared between studies conducted months or years apart. A drawback to the one-color system is that, when compared to the two-color system, twice as many microarrays are needed to compare samples within an experiment.
Microarrays and bioinformatics

The advent of inexpensive microarray experiments created several specific bioinformatics challenges:
- the multiple levels of replication in experimental design (Experimental design)
- the number of platforms and independent groups and data format (Standardization)
- the treatment of the data (Statistical analysis)
- what exactly are we measuring (Relation between probe and gene)
- the sheer volume of data and the ability to share it (Data warehousing)
Experimental design
Due to the biological complexity of gene expression, the considerations of experimental design that are discussed in the expression profiling article are of critical importance if statistically and biologically valid conclusions are to be drawn from the data.
There are three main elements to consider when designing a microarray experiment. First, replication of the biological samples is essential for drawing conclusions from the experiment. Second, technical replicates (two RNA samples obtained from each experimental unit) help to ensure precision and allow for testing differences within treatment groups. The technical replicates may be two independent RNA extractions or two aliquots of the same extraction. Third, spots of each cDNA clone or oligonucleotide are present as replicates (at least duplicates) on the microarray slide, to provide a measure of technical precision in each hybridization. It is critical that information about the sample preparation and handling is discussed, in order to help identify the independent units in the experiment and to avoid inflated estimates of statistical significance.[14]
Standardization
Microarray data is difficult to exchange due to the lack of standardization in platform fabrication, assay protocols, and analysis methods. This presents an interoperability problem in bioinformatics. Various grass-roots open-source projects are trying to ease the exchange and analysis of data produced with non-proprietary chips:
- For example, the "Minimum Information About a Microarray Experiment" (MIAME) checklist helps define the level of detail that should exist and is being adopted by many journals as a requirement for the submission of papers incorporating microarray results. But MIAME does not describe the format for the information, so while many formats can support the MIAME requirements, as of 2007 no format permits verification of complete semantic compliance.
- The "MicroArray Quality Control (MAQC) Project" is being conducted by the US Food and Drug Administration (FDA) to develop standards and quality control metrics which will eventually allow the use of MicroArray data in drug discovery, clinical practice and regulatory decision-making. [15]
- The MGED Society has developed standards for the representation of gene expression experiment results and relevant annotations.
Statistical analysis
The analysis of DNA microarrays poses a large number of statistical problems, including the normalization of the data. There are several normalization methods in the published literature some of which are platform specific; as in many other cases where authorities disagree, a sound conservative approach is to directly compare different normalization methods to determine the effects of these different methods on the results obtained. This can be done, for example, by investigating the performance of various methods on data from "spike-in" experiments.
Also, experimenters must account for multiple comparisons: even if the statistical P-value assigned to a gene indicates that it is extremely unlikely that differential expression of this gene was due to random rather than treatment effects, the very high number of genes on an array makes it likely that differential expression of some genes represent false positives or false negatives. Statistical methods tailored to microarray analyses have recently become available that assess statistical power based on the variation present in the data and the number of experimental replicates, and can help minimize type I and type II errors in the analyses.[16]
A basic difference between microarray data analysis and much traditional biomedical research is the dimensionality of the data. A large clinical study might collect 100 data items per patient for thousands of patients. A medium-size microarray study will obtain many thousands of numbers per sample for perhaps a hundred samples. Many analysis techniques treat each sample as a single point in a space with thousands of dimensions, then attempt by various techniques to reduce the dimensionality of the data to something humans can visualize. [17]
Relation between probe and gene
The relation between a probe and the mRNA that it is expected to detect is problematic. On the one hand, some mRNAs may cross-hybridize probes in the array that are supposed to detect another mRNA. On the other hand, probes that are designed to detect the mRNA of a particular gene may be relying on genomic EST information that is incorrectly associated with that gene.
Data warehousing
Microarray data was found to be more useful when compared to other similar datasets. The sheer volume (in bytes), specialized formats (such as MIAME), and curation efforts associated with the datasets require specialized databases to store the data.
See also
- Microfluidics or lab-on-chip
- Cyanine dyes, such as Cy3 and Cy5, are commonly used fluorophores with microarrays
- Serial analysis of gene expression
- Significance analysis of microarrays
References
- ↑ Kulesh DA, Clive DR, Zarlenga DS, Greene JJ (1987). "Identification of interferon-modulated proliferation-related cDNA sequences". Proc Natl Acad Sci USA 84: 8453–8457. doi:. PMID 2446323.
- ↑ Schena M, Shalon D, Davis RW, Brown PO (1995). "Quantitative monitoring of gene expression patterns with a complementary DNA microarray". Science 270: 467–470. doi:. PMID 7569999.
- ↑ Lashkari DA, DeRisi JL, McCusker JH, Namath AF, Gentile C, Hwang SY, Brown PO, Davis RW (1997). "Yeast microarrays for genome wide parallel genetic and gene expression analysis". Proc Natl Acad Sci USA 94: 13057–13062. doi:. PMID 9371799.
- ↑ Adomas A, Heller G, Olson A, Osborne J, Karlsson M, Nahalkova J, Van Zyl L, Sederoff R, Stenlid J, Finlay R, Asiegbu FO (2008). "Comparative analysis of transcript abundance in Pinus sylvestris after challenge with a saprotrophic, pathogenic or mutualistic fungus". Tree Physiol. 28: 885–897. PMID 18381269.
- ↑ Pollack JR, Perou CM, Alizadeh AA, Eisen MB, Pergamenschikov A, Williams CF, Jeffrey SS, Botstein D, Brown PO (1999). "Genome-wide analysis of DNA copy-number changes using cDNA microarrays". Nat Genet 23: 41–46. doi:. PMID 10471496.
- ↑ Moran G, Stokes C, Thewes S, Hube B, Coleman DC, Sullivan D (2004). "Comparative genomics using Candida albicans DNA microarrays reveals absence and divergence of virulence-associated genes in Candida dubliniensis". Microbiology 150: 3363–3382. doi:. PMID 15470115.
- ↑ Hacia JG, Fan JB, Ryder O, Jin L, Edgemon K, Ghandour G, Mayer RA, Sun B, Hsie L, Robbins CM, Brody LC, Wang D, Lander ES, Lipshutz R, Fodor SP, Collins FS (1999). "Determination of ancestral alleles for human single-nucleotide polymorphisms using high-density oligonucleotide arrays". Nat Genet 22: 164-167. doi:. PMID 10369258.
- ↑ Lausted C et al. (2004). "POSaM: a fast, flexible, open-source, inkjet oligonucleotide synthesizer and microarrayer". Genome Biology 5: R58. doi:. PMID 15287980. http://genomebiology.com/2004/5/8/R58.
- ↑ Bammler T, Beyer RP, Bhattacharya S, Boorman GA, Boyles A, Bradford BU, Bumgarner RE, Bushel PR, Chaturvedi K, Choi D, Cunningham ML, Deng S, Dressman HK, Fannin RD, Farin FM, Freedman JH, Fry RC, Harper A, Humble MC, Hurban P, Kavanagh TJ, Kaufmann WK, Kerr KF, Jing L, Lapidus JA, Lasarev MR, Li J, Li YJ, Lobenhofer EK, Lu X, Malek RL, Milton S, Nagalla SR, O'malley JP, Palmer VS, Pattee P, Paules RS, Perou CM, Phillips K, Qin LX, Qiu Y, Quigley SD, Rodland M, Rusyn I, Samson LD, Schwartz DA, Shi Y, Shin JL, Sieber SO, Slifer S, Speer MC, Spencer PS, Sproles DI, Swenberg JA, Suk WA, Sullivan RC, Tian R, Tennant RW, Todd SA, Tucker CJ, Van Houten B, Weis BK, Xuan S, Zarbl H; Members of the Toxicogenomics Research Consortium. (2005). "Standardizing global gene expression analysis between laboratories and across platforms". Nat Methods 2: 351–356. doi:. PMID 15846362.
- ↑ Pease AC, Solas D, Sullivan EJ, Cronin MT, Holmes CP, Fodor SP. (1994). "Light-generated oligonucleotide arrays for rapid DNA sequence analysis". PNAS 91: 5022–5026. doi:. PMID 8197176.
- ↑ Nuwaysir EF, Huang W, Albert TJ, Singh J, Nuwaysir K, Pitas A, Richmond T, Gorski T, Berg JP, Ballin J, McCormick M, Norton J, Pollock T, Sumwalt T, Butcher L, Porter D, Molla M, Hall C, Blattner F, Sussman MR, Wallace RL, Cerrina F, Green RD. (2002). "Gene expression analysis using oligonucleotide arrays produced by maskless photolithography". Genome Res 12: 1749–1755. doi:. PMID 12421762.
- ↑ Shalon D, Smith SJ, Brown PO (1996). "A DNA microarray system for analyzing complex DNA samples using two-color fluorescent probe hybridization". Genome Res 6: 639–645. doi:. PMID 8796352.
- ↑ Tang T, François N, Glatigny A, Agier N, Mucchielli MH, Aggerbeck L, Delacroix H (2007). "Expression ratio evaluation in two-colour microarray experiments is significantly improved by correcting image misalignment". Bioinformatics 23: 2686–2691. doi:. PMID 17698492.
- ↑ Churchill GA (2002). "Fundamentals of experimental design for cDNA microarrays". Nature genetics suppliment 32: 490. doi:. http://www.vmrf.org/research-websites/gcf/Forms/Churchill.pdf.
- ↑ NCTR Center for Toxicoinformatics - MAQC Project
- ↑ Wei C, Li J, Bumgarner RE. (2004). "Sample size for detecting differentially expressed genes in microarray experiments". BMC Genomics 5: 87. doi:. PMID 15533245.
- ↑ Wouters L, Gõhlmann HW, Bijnens L, Kass SU, Molenberghs G, Lewi PJ (2003). "Graphical exploration of gene expression data: a comparative study of three multivariate methods". Biometrics 59: 1131–1139. doi:.
Glossary
- An Array or slide is a collection of features spatially arranged in a two dimensional grid, arranged in columns and rows.
- Block or subarray: a group of spots, typically made in one print round; several subarrays/blocks form an array.
- Case/control: an experimental design paradigm especially suited to the two-colour array system, in which a condition chosen as control (such as healthy tissue or state) is compared to an altered condition (such as a diseased tissue or state).
- Channel: the fluorescence output recorded in the scanner for an individual fluorophore and can even be ultraviolet.
- Dye flip or Dye swap or Fluor reversal: reciprocal labelling of DNA targets with the two dyes to account for dye bias in experiments.
- Scanner: an instrument used to detect and quantify the intensity of fluorescence of spots on a microarray slide, by selectively exciting fluorophores with a laser and measuring the fluorescence with a filter (optics) photomultiplier system.
- Spot or feature: a small area on an array slide that contains picomoles of specific DNA samples.
- For other relevant terms see:
- Glossary of gene expression terms
- Protocol (natural sciences)
External links
- Many important links can be found at the Open Directory Project
- Gene Expression at the Open Directory Project
- Micro Scale Products and Services for Biochemistry and Molecular Biology at the Open Directory Project
- Products and Services for Gene Expression at the Open Directory Project
- PLoS Biology Primer: Microarray Analysis
- Rundown of microarray technology
- CLASSIFI - Gene Ontology-based gene cluster classification resource
|
||||||||||||||||||||||||||
|
|||||||||||||||||||||||