CIE 1931 color space
In the study of the perception of color, one of the first mathematically defined color spaces was the CIE 1931 XYZ color space (also known as CIE 1931 color space), created by the International Commission on Illumination (CIE) in 1931.[1][2]
The CIE XYZ color space was derived from a series of experiments done in the late 1920s by W. David Wright[3] and John Guild.[4] Their experimental results were combined into the specification of the CIE RGB color space, from which the CIE XYZ color space was derived. This article is concerned with both of these color spaces.
Contents |
Tristimulus values
The human eye has receptors (called cone cells) for short (S), middle (M), and long (L) wavelengths. Thus in principle, three parameters describe a color sensation. The tristimulus values of a color are the amounts of three primary colors in a three-component additive color model needed to match that test color. The tristimulus values are most often given in the CIE 1931 color space, in which they are denoted X, Y, and Z.[5]
Any specific method for associating tristimulus values with each color is called a color space. CIE XYZ, one of many such spaces, is special because it is based on direct measurements of human visual perception, and serves as the basis from which many other color spaces are defined.
The CIE standard observer
In the CIEXYZ color space, the tristimulus values are not the S, M, and L responses of the human eye, but rather a set of tristimulus values called X, Y, and Z, which are roughly red, green and blue, respectively. (But be careful that the X,Y,Z values are not physically observed red, green, blue colors. The X,Y,Z values are a sort of 'derived' parameters from the red, green, blue colors.) Two light sources, made up of different mixtures of various wavelengths, may appear to be the same color; this effect is called metamerism. Two light sources have the same apparent color to an observer when they have the same tristimulus values, no matter what spectral distributions of light were used to produce them.
Due to the nature of the distribution of cones in the eye, the tristimulus values depend on the observer's field of view. To eliminate this variable, the CIE defined the standard (colorimetric) observer. Originally this was taken to be the chromatic response of the average human viewing through a 2° angle, due to the belief that the color-sensitive cones resided within a 2° arc of the fovea. Thus the CIE 1931 Standard Observer is also known as the CIE 1931 2° Standard Observer. A more modern but less-used alternative is the CIE 1964 10° Standard Observer, which is derived from the work of Stiles and Burch,[6] and Speranskaya.[7]
For the 10° experiments, the observers were instructed to ignore the central 2° spot. The 1964 Supplementary Standard Observer is recommended for more than about a 4° field of view. Both standard observers are discretized at 5 nm wavelength intervals and distributed by the CIE.[8]
The standard observer is characterized by three color matching functions.
The derivation of the CIE standard observer from color matching experiments is derived below, after the description of the CIERGB space.
Color matching functions

The color matching functions are the numerical description of the chromatic response of the observer (described above).
The CIE has defined a set of three color-matching functions, called  ,
,  , and
, and  , which can be thought of as the spectral sensitivity curves of three linear light detectors that yield the CIEXYZ tristimulus values X, Y, and Z. The tabulated numerical values of these functions are known collectively as the CIE standard observer.[9]
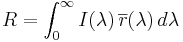
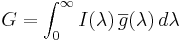
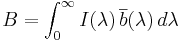
The tristimulus values for a color with a spectral power distribution  are given in terms of the standard observer by:
where  is the wavelength of the equivalent monochromatic light (measured in nanometers).
Other observers, such as for the CIERGB space or other RGB color spaces, are defined by other sets of three color-matching functions, and lead to tristimulus values in those other spaces.
The CIE xy chromaticity diagram and the CIE xyY color space

Since the human eye has three types of color sensors that respond to different ranges of wavelengths, a full plot of all visible colors is a three-dimensional figure. However, the concept of color can be divided into two parts: brightness and chromaticity. For example, the color white is a bright color, while the color grey is considered to be a less bright version of that same white. In other words, the chromaticity of white and grey are the same while their brightness differs.
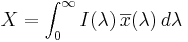
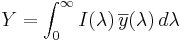
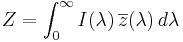
The CIE XYZ color space was deliberately designed so that the Y parameter was a measure of the brightness or luminance of a color. The chromaticity of a color was then specified by the two derived parameters x and y, two of the three normalized values which are functions of all three tristimulus values X, Y, and Z:
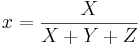
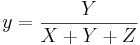
The derived color space specified by x, y, and Y is known as the CIE xyY color space and is widely used to specify colors in practice.
The X and Z tristimulus values can be calculated back from the chromaticity values x and y and the Y tristimulus value:

The figure on the right shows the related chromaticity diagram. The outer curved boundary is the spectral locus, with wavelengths shown in nanometers. Note that the chromaticity diagram is a tool to specify how the human eye will experience light with a given spectrum. It cannot specify colors of objects (or printing inks), since the chromaticity observed while looking at an object depends on the light source as well.
Mathematically, x and y are projective coordinates and the colors of the chromaticity diagram occupy a region of the real projective plane.
The chromaticity diagram illustrates a number of interesting properties of the CIE XYZ color space:
- The diagram represents all of the chromaticities visible to the average person. These are shown in color and this region is called the gamut of human vision. The gamut of all visible chromaticities on the CIE plot is the tongue-shaped or horseshoe-shaped figure shown in color. The curved edge of the gamut is called the spectral locus and corresponds to monochromatic light, with wavelengths listed in nanometers. The straight edge on the lower part of the gamut is called the line of purples. These colors, although they are on the border of the gamut, have no counterpart in monochromatic light. Less saturated colors appear in the interior of the figure with white at the center.
- It is seen that all visible chromaticities correspond to non-negative values of x, y, and z (and therefore to non-negative values of X, Y, and Z).
- If one chooses any two points on the chromaticity diagram, then all colors that can be formed by mixing these two colors lie between those two points, on a straight line connecting them. It follows that the gamut of colors must be convex in shape. All colors that can be formed by mixing three sources are found inside the triangle formed by the source points on the chromaticity diagram (and so on for multiple sources).
- An equal mixture of two equally bright colors will not generally lie on the midpoint of that line segment. In more general terms, a distance on the xy chromaticity diagram does not correspond to the degree of difference between two colors. In the early 1940s, David MacAdam studied the nature of visual sensitivity to color differences, and summarized his results in the concept of a MacAdam ellipse. Based on the work of MacAdam, the CIE 1960, CIE 1964, and CIE 1976 color spaces were developed, with the goal of achieving perceptual uniformity (have an equal distance in the color space correspond to equal differences in color). Although they were a distinct improvement over the CIE 1931 system, they were not completely free of distortion.
- It can be seen that, given three real sources, these sources cannot cover the gamut of human vision. Geometrically stated, there are no three points within the gamut that form a triangle that includes the entire gamut; or more simply, the gamut of human vision is not a triangle.
- Light with a flat energy spectrum corresponds to the point (x,y) = (1/3,1/3).
Definition of the CIE XYZ color space
Experimental results—the CIE RGB color space
The CIE RGB colour space is one of many RGB color spaces, distinguished by a particular set of monochromatic (single-wavelength) primary colors.
In the 1920s, W. David Wright[3] and John Guild[4] independently conducted a series of experiments on human sight which laid the foundation for the specification of the CIE XYZ color space.

The experiments were conducted by using a circular split screen 2 degrees in size, which is the angular size of the human fovea. On one side of the field a test color was projected and on the other side, an observer-adjustable color was projected. The adjustable color was a mixture of three primary colors, each with fixed chromaticity, but with adjustable brightness.
The observer would alter the brightness of each of the three primary beams until a match to the test color was observed. Not all test colors could be matched using this technique. When this was the case, a variable amount of one of the primaries could be added to the test color, and a match with the remaining two primaries was carried out with the variable color spot. For these cases, the amount of the primary added to the test color was considered to be a negative value. In this way, the entire range of human color perception could be covered. When the test colors were monochromatic, a plot could be made of the amount of each primary used as a function of the wavelength of the test color. These three functions are called the color matching functions for that particular experiment.

Although Wright and Guild's experiments were carried out using various primaries at various intensities, and a number of different observers, all of their results were summarized by the standardized CIE RGB color matching functions  ,
,  , and
, and  , obtained using three monochromatic primaries at standardized wavelengths of 700 nm (red), 546.1 nm (green) and 435.8 nm (blue). The color matching functions are the amounts of primaries needed to match the monochromatic test primary. These functions are shown in the plot on the right (CIE 1931). Note that and are zero at 435.8, and are zero at 546.1 and and are zero at 700 nm, since in these cases the test color is one of the primaries. The primaries with wavelengths 546.1 nm and 435.8 nm were chosen because they are easily reproducible monochromatic lines of a mercury vapor discharge. The 700 nm wavelength, which in 1931 was difficult to reproduce as a monochromatic beam, was chosen because the eye's perception of color is rather unchanging at this wavelength, and therefore small errors in wavelength of this primary would have little effect on the results.
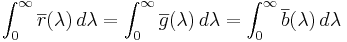
The color matching functions and primaries were settled upon by a CIE special commission after considerable deliberation.[10] The cut-offs at the short- and long-wavelength side of the diagram are chosen somewhat arbitrarily; the human eye can actually see light with wavelengths up to about 810 nm, but with a sensitivity that is many thousand times lower than for green light. These color matching functions define what is known as the "1931 CIE standard observer". Note that rather than specify the brightness of each primary, the curves are normalized to have constant area beneath them. This area is fixed to a particular value by specifying that
The resulting normalized color matching functions are then scaled in the r:g:b ratio of 1:4.5907:0.0601 for source luminance and 72.0962:1.3791:1 for source radiant power to reproduce the true color matching functions. By proposing that the primaries be standardized, the CIE established an international system of objective color notation.
Given these scaled color matching functions, the RGB tristimulus values for a color with a spectral power distribution  would then be given by:
These are all inner products and can be thought of as a projection of an infinite-dimensional spectrum to a three-dimensional color.
Grassmann's law
One might ask: "Why is it possible that Wright and Guild's results can be summarized using different primaries and different intensities from those actually used?" One might also ask: "What about the case when the test colors being matched are not monochromatic?" The answer to both of these questions lies in the (near) linearity of human color perception. This linearity is expressed in Grassmann's law.
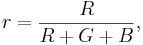
The CIE RGB space can be used to define chromaticity in the usual way: The chromaticity coordinates are r and g where:
Construction of the CIE XYZ color space from the Wright–Guild data
Having developed an RGB model of human vision using the CIE RGB matching functions, the members of the special commission wished to develop another color space that would relate to the CIE RGB color space. It was assumed that Grassmann's law held, and the new space would be related to the CIE RGB space by a linear transformation. The new space would be defined in terms of three new color matching functions , , and as described above. The new color space would be chosen to have the following desirable properties:

- The new color matching functions were to be everywhere greater than or equal to zero. In 1931, computations were done by hand or slide rule, and the specification of positive values was a useful computational simplification.
- The color matching function would be exactly equal to the photopic luminous efficiency function V(λ) for the "CIE standard photopic observer".[11] The luminance function describes the variation of perceived brightness with wavelength. The fact that the luminance function could be constructed by a linear combination of the RGB color matching functions was not guaranteed by any means but might be expected to be nearly true due to the near-linear nature of human sight. Again, the main reason for this requirement was computational simplification.
- For the constant energy white point, it was required that x = y = z = 1/3.
- By virtue of the definition of chromaticity and the requirement of positive values of x and y, it can be seen that the gamut of all colors will lie inside the triangle [1,0], [0,0], [0,1]. It was required that the gamut fill this space practically completely.
- It was found that the color matching function could be set to zero above 650 nm while remaining within the bounds of experimental error. For computational simplicity, it was specified that this would be so.
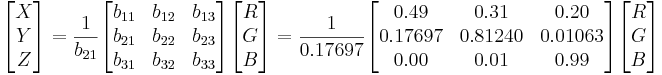
In geometrical terms, choosing the new color space amounts to choosing a new triangle in rg chromaticity space. In the figure above-right, the rg chromaticity coordinates are shown on the two axes in black, along with the gamut of the 1931 standard observer. Shown in red are the CIE xy chromaticity axes which were determined by the above requirements. The requirement that the XYZ coordinates be non-negative means that the triangle formed by Cr, Cg, Cb must encompass the entire gamut of the standard observer. The line connecting Cr and Cb is fixed by the requirement that the function be equal to the luminance function. This line is the line of zero luminance, and is called the alychne. The requirement that the function be zero above 650 nm means that the line connecting Cg and Cr must be tangent to the gamut in the region of Kr. This defines the location of point Cr. The requirement that the equal energy point be defined by x = y = 1/3 puts a restriction on the line joining Cb and Cg, and finally, the requirement that the gamut fill the space puts a second restriction on this line to be very close to the gamut in the green region, which specifies the location of Cg and Cb. The above described transformation is a linear transformation from the CIE RGB space to XYZ space. The standardized transformation settled upon by the CIE special commission was as follows:
The numbers below all have the correct number of significant digits per CIE standards.[10]
The integrals of the XYZ color matching functions must all be equal by requirement 3 above, and this is set by the integral of the photopic luminous efficiency function by requirement 2 above. It must be noted that the tabulated sensitivity curves have a certain amount of arbitrariness in them. The shapes of the individual X, Y and Z sensitivity curves can be measured with a reasonable accuracy. However, the overall luminosity curve (which in fact is a weighted sum of these three curves) is subjective, since it involves asking a test person whether two light sources have the same brightness, even if they are in completely different colors. Along the same lines, the relative magnitudes of the X, Y, and Z curves are arbitrary. One could as well define a valid color space with an X sensitivity curve that has twice the amplitude. This new color space would have a different shape. The sensitivity curves in the CIE 1931 and 1964 XYZ color spaces are scaled to have equal areas under the curves.
See also
- Imaginary color
- Lab color space
References
- ↑ CIE (1932). Commission internationale de l'Eclairage proceedings, 1931. Cambridge University Press, Cambridge.
- ↑ Smith, Thomas; Guild, John (1931-32). "The C.I.E. colorimetric standards and their use". Transactions of the Optical Society 33 (3): 73–134. doi:.
- ↑ 3.0 3.1 Wright, William David (1928). "A re-determination of the trichromatic coefficients of the spectral colours". Transactions of the Optical Society 30: 141–164. doi:.
- ↑ 4.0 4.1 Guild, John (1931). "The colorimetric properties of the spectrum". Philosophical Transactions of the Royal Society of London A230: 149–187. http://www.jstor.org/stable/91229.
- ↑ Hunt, R. W. (1998). Measuring colour (3rd edition ed.). Fountain Press, England. ISBN 0-86343-387-1.. See pgs. 39-46 for the basis in human eye physiology of three-component color models, and 54-57 for chromaticity coordinates.
- ↑ Stiles, Walter Stanley & Birch, Jennifer M. (1958). "N.P.L. colour matching investigation: final report". Optica Acta 6: 1–26.
- ↑ Speranskaya, N.I. (1959). "Determination of spectrum color co-ordinates for twenty seven normal observers". Optics and Spectroscopy 7: 424–428.
- ↑ "CIE Free Documents for Download".
- ↑ A. C. Harris and I. L. Weatherall (September 1990). "Objective evaluation of colour variation in the sand-burrowing beetle Chaerodes trachyscelides White (Coleoptera: Tenebrionidae) by instrumental determination of CIELAB values". Journal of the Royal Society of New Zealand 20 (3). http://books.google.com/books?id=ErI4AAAAIAAJ&pg=PA254&dq=cie+standard-observer&lr=&as_brr=1&ei=TAKUR7-vBIjssQO__d1D&sig=E7HZ8zTTFUFPNWCOije0sC9zu74#PPA253,M1.
- ↑ 10.0 10.1 Fairman H.S., Brill M.H., Hemmendinger H. (February 1997). "How the CIE 1931 Color-Matching Functions Were Derived from the Wright–Guild Data". Color Research and Application 22 (1): 11–23. doi:. and Fairman H.S., Brill M.H., Hemmendinger H. (August 1998). "Erratum: How the CIE 1931 Color-Matching Functions Were Derived from the Wright–Guild Data". Color Research and Application 23 (4): 259. doi:.
- ↑ CIE (1926). Commission internationale de l'Eclairage proceedings, 1924. Cambridge University Press, Cambridge. Note that the 1924 luminous efficiency function seriously underestimates sensitivity at wavelengths below 460 nm, and has been supplemented with newer and more accurate luminosity curves; see Luminosity function#Improvements to the standard.
Further reading
- Broadbent, Arthur D. (August 2004). "A critical review of the development of the CIE1931 RGB color-matching functions". Color Research & Applications 29 (4): 267–272. doi:. "This article describes the development of the CIE1931 chromaticity coordinates and color-matching functions starting from the initial experimental data of W. D. Wright and J. Guild. Sufficient information is given to allow the reader to reproduce and verify the results obtained at each stage of the calculations and to analyze critically the procedures used. Unfortunately, some of the information required for the coordinate transformations was never published and the appended tables provide likely versions of that missing data.".
- Trezona, Pat W. (2001). "Derivation of the 1964 CIE 10° XYZ Colour-Matching Functions and Their Applicability in Photometry". Color Research and Application 26 (1): 67–75. doi:.
- Wright, William David (2007). "Golden Jubilee of Colour in the CIE—The Historical and Experimental Background to the 1931 CIE System of Colorimetry". in János Schanda. Colorimetry. Wiley Interscience. pp. 9-24. doi:. ISBN 9780470049044. (originally published by the Society of Dyers and Colourists, Bradford, 1981.)
External links
- Introduction to Colour Science, William Andrew Steer.
- efg's Color Chromaticity Diagrams Lab Report and Delphi source
- CIE Color Space, Gernot Hoffman
- Annotated downloadable data tables, Andrew Stockman and Lindsay T. Sharpe.
- Calculation from the original experimental data of the CIE 1931 RGB standard observer spectral chromaticity co-ordinates and color matching functions
- Colorimetric data useful for calculation, in various file formats
|
||||||||||||||||||||