From Wikipedia, the free encyclopedia
a.PNG/800px-Ukrainian_parliamentary_election_2007_(BYuT)a.PNG) Size of this preview: 800 × 568 pixelsFull resolution
Size of this preview: 800 × 568 pixelsFull resolution (2,465 × 1,749 pixels, file size: 486 KB, MIME type: image/png)
[edit] Summary
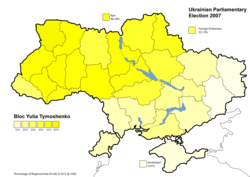
Ukrainian Parliamentary Election 2007 (BYuT) Percentage of total national vote (minimal text)
[edit] Ukrainian parliamentary election, 2007
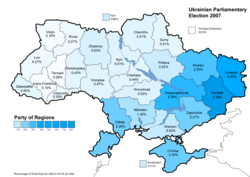
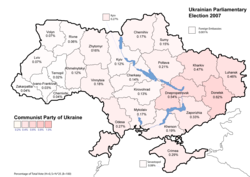
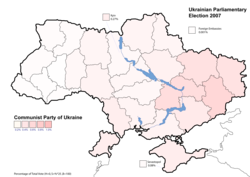
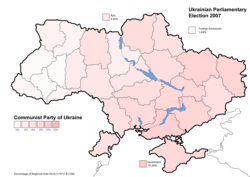
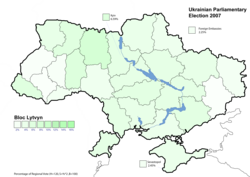
The collection of images below provide a graphical representation of the 2007 Ukrainian Parliamentary Election.
All data is derived from the published official results provided by the Ukrainian Authority (See links and data tables below)
It is important when analysing the information presented that the user notes that the information is based on National results and also as a percentage of the regional tally as provided by the Ukrainian Electoral Committee.
The swing analysis charts are based on the comparison of the 2006 to 2007 election results.
The carts are designed to show a correct correlation between each party and region by means of charts and color shaded maps. It is best that both maps and charts are displayed together.
[edit] Collection
Results of the parliamentary elections:
|
|
|
 |
A swing analysis is common in any election. It shows the change in voter percentage for each party by regions from 2006 to 2007.
Maps showing the top six parties support - percentage of total national vote
|
|
|
|
|
|
|
|
Maps showing the top six parties support - percentage of total national vote (minimal text)
|
|
|
|
|
|
|
|
Maps showing the top six parties support - percentage per region
|
|
|
|
|
|
|
|
[edit] Data tables
[edit] Regional results

Highest vote per region (Percentage by national vote)

Results by electoral region (Percentage by national total vote)

Vote (Percentage by electoral region)
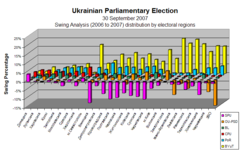
Swing 2006 to 2007 (Percentage by electoral regions)
| Region |
Voter enrolment |
Turn-out % |
PoR |
BYuT |
OU-PSD |
CPU |
BL |
SPU |
| Ukraine |
37,185,882 |
62.70 |
34.4 |
30.7 |
14.2 |
5.4 |
4.0 |
2.9 |
| Eastern |
|
63.8 |
66.5 |
7.5 |
3.4 |
7.3 |
2.2 |
4.9 |
| Donetsk Oblast |
3,620,888 |
66.0 |
76.0 |
4.5 |
2.0 |
6.8 |
1.0 |
1.3 |
| Luhansk Oblast |
1,898,637 |
66.3 |
73.5 |
5.1 |
1.7 |
8.5 |
2.4 |
1.3 |
| Kharkiv Oblast |
2,282,993 |
58.3 |
49.6 |
16.4 |
8.1 |
8.3 |
4.6 |
2.6 |
| Southern |
|
57.0 |
54.6 |
13.6 |
6.5 |
7.7 |
4.6 |
3.4 |
| Autonomous Republic of Crimea |
1,568,070 |
55.8 |
61.0 |
6.9 |
8.2 |
7.6 |
3.9 |
1.9 |
| Zaporizhia Oblast |
1,515,832 |
61.4 |
55.5 |
14.7 |
4.7 |
8.3 |
5.5 |
2.3 |
| Mykolaiv Oblast |
971,038 |
57.6 |
54.4 |
16.6 |
5.8 |
7.2 |
4.5 |
1.9 |
| Odesa Oblast |
1,851,868 |
54.5 |
52.2 |
13.7 |
6.5 |
6.2 |
5.1 |
7.2 |
| Kherson Oblast |
893,442 |
55.5 |
43.2 |
23.1 |
9.1 |
9.1 |
3.7 |
2.5 |
| [[m. Sevastopol}Sevastopol']] |
308,928 |
59.7 |
64.5 |
5.0 |
2.3 |
10.3 |
2.5 |
2.7 |
| Center |
|
60.5 |
30.6 |
34.8 |
11.8 |
6.4 |
4.7 |
2.4 |
| Vinnytsia Oblast |
1,342,608 |
64.5 |
12.6 |
50.0 |
18.6 |
5.0 |
3.1 |
2.5 |
| Dnipropetrovsk Oblast |
2,810,168 |
58.9 |
48.7 |
20.8 |
6.2 |
7.6 |
5.0 |
1.3 |
| Kirovohrad Oblast |
614,832 |
57.9 |
27.0 |
37.6 |
11.7 |
6.4 |
5.5 |
2.8 |
| Poltava Oblast |
1250,952 |
61.9 |
24.8 |
37.9 |
14.5 |
6.5 |
4.9 |
3.0 |
| Cherkasy Oblast |
1,095,058 |
60.1 |
15.5 |
47.0 |
15.3 |
4.9 |
4.9 |
4.3 |
| Northern |
|
62.5 |
16.7 |
45.5 |
16.1 |
4.9 |
5.7 |
2.1 |
| Zhytomyr Oblast |
1,044,852 |
62.5 |
22.4 |
37.0 |
15.1 |
5.8 |
8.3 |
2.5 |
| Kyiv Oblast |
1,679,197 |
61.9 |
13.0 |
53.4 |
15.1 |
3.0 |
5.1 |
2.2 |
| Sumy Oblast |
990,575 |
62.0 |
15.7 |
44.5 |
20.8 |
5.8 |
3.3 |
2.0 |
| Chernihiv Oblast |
939,072 |
61.8 |
20.7 |
41.9 |
14.9 |
6.7 |
4.2 |
2.9 |
| Kyiv |
2,151,576 |
63.5 |
15.0 |
46.2 |
15.8 |
4.6 |
6.6 |
1.6 |
| Western |
|
68.4 |
8.3 |
48.9 |
29.1 |
1.8 |
3.2 |
1.6 |
| Volyn Oblast |
801,557 |
71.0 |
6.7 |
57.6 |
20.0 |
2.7 |
4.6 |
1.9 |
| Zakarpattia Oblast |
946,525 |
52.1 |
19.8 |
28.9 |
31.1 |
1.8 |
6.0 |
3.5 |
| Ivano-Frankivsk Oblast |
1,080,296 |
72.6 |
3.0 |
50.7 |
36.8 |
0.8 |
1.0 |
0.8 |
| Lviv Oblast |
2,002,372 |
73.9 |
4.2 |
50.4 |
36.0 |
1.0 |
1.1 |
0.6 |
| Rivne Oblast |
865,092 |
68.7 |
10.4 |
51.0 |
20.8 |
2.4 |
6.1 |
2.1 |
| Ternopil Oblast |
870,214 |
76.5 |
3.0 |
51.6 |
35.2 |
0.7 |
1.6 |
1.1 |
| Khmelnytsky Oblast |
1,083,968 |
66.3 |
14.1 |
48.2 |
18.4 |
4.0 |
6.6 |
1.7 |
| Chernivtsi Oblast |
705,272 |
58.2 |
16.8 |
46.2 |
20.3 |
2.3 |
2.5 |
3.8 |
| Foreign Embassies |
431,142 |
6.0 |
26.5 |
33.1 |
25.5 |
1.6 |
2.3 |
1.2 |
[edit] National results
[discuss] – [edit]
Summary of the 30 September 2007 Verkhovna Rada election results
| Parties and blocs |
Votes |
% |
Seats |
  |
| Party of Regions (Партія регіонів) |
8,013,895 |
34.37 |
175 |
 +11 (186) +11 (186) |
| Yulia Tymoshenko Bloc (Блок Юлії Тимошенко)
|
7,162,193 |
30.71 |
156 |
 +27 (129) +27 (129) |
| Our Ukraine–People's Self-Defense Bloc (Блок Наша Україна–Народна Самооборона)
|
3,301,282 |
14.15 |
72 |
 –9 (63) –9 (63) |
| Communist Party of Ukraine (Комуністична партія України) |
1,257,291 |
5.39 |
27 |
 +6 (21) +6 (21) |
| Lytvyn Bloc (Блок Литвина)
|
924,538 |
3.96 |
20 |
 +20 (0) +20 (0) |
| Socialist Party of Ukraine (Соціалістична партія України) |
668,234 |
2.86 |
|
 0 (–33) 0 (–33) |
| Progressive Socialist Party of Ukraine (Прогресивна соціалістична партія України) |
309,008 |
1.32 |
|
|
| All-Ukrainian Union "Freedom" (Всеукраїнське об'єднання "Свобода") |
178,660 |
0.76 |
|
|
| Party of Greens of Ukraine (Партія Зелених України) |
94,505 |
0.40 |
|
|
| Electoral Bloc of Liudmyla Suprun – Ukrainian Regional Asset (Виборчий блок Людмили Супрун — Український регіональний актив)
|
80,944 |
0.34 |
|
|
| Communist Party of Ukraine (renewed) (Комуністична партія України (оновлена)) |
68,602 |
0.29 |
|
|
| Party of Free Democrats (Партія Вільних Демократів) |
50,852 |
0.21 |
|
|
| Bloc of the Party of Pensioners of Ukraine (Блок партії пенсіонерів України)
|
34,845 |
0.14 |
|
|
| Party of National Economic Development of Ukraine (Партія національно-економічного розвитку України) |
33,489 |
0.14 |
|
|
| Ukrainian People's Bloc (Український Народний Блок)
|
28,414 |
0.12 |
|
|
| Peasants' Bloc "Agrarian Ukraine" (Селянський Блок "Аграрна Україна")
|
25,675 |
0.11 |
|
|
| Christian Bloc (Християнський блок)
|
24,597 |
0.10 |
|
|
| Electoral Bloc of Political Parties "KUCHMA" (Виборчий блок політичних партій «КУЧМА»)
|
23,676 |
0.10 |
|
|
| Bloc "All-Ukrainian Community" (Блок "Всеукраїнська громада")
|
12,327 |
0.05 |
|
|
| All-Ukrainian Party of People's Trust (Всеукраїнська партія Народної Довіри) |
5,342 |
0.02 |
|
|
| Against all |
637,185 |
2.73 |
|
|
| Invalid ballot papers |
379,658 |
1.62 |
|
|
| Total (turnout 62.02%) |
23,315,257 |
100 |
450 |
|
| Source: Central Election Commission of Ukraine (English) |
[edit] Data source
2007 [1] [2] [3] [4] [5] [6]
2006 [7] [8] [9] [10] [11] [12]
Swing analysis is common in any election. It shows the change in voter percentage for each party by regions from 2006 to 2007.
[edit] Licensing
|
I, the copyright holder of this work, hereby publish it under the following licenses:
You may select the license of your choice.
|
File history
Click on a date/time to view the file as it appeared at that time.
| Date/Time | Dimensions | User | Comment |
|---|
| current | 15:25, 20 February 2008 | 2,465×1,749 (486 KB) | DemocracyATwork | |
| 22:51, 19 February 2008 | 2,476×1,750 (489 KB) | DemocracyATwork | |
| 14:46, 19 February 2008 | 2,468×1,719 (351 KB) | DemocracyATwork | |
File links
The following pages on the English Wikipedia link to this file (pages on other projects are not listed):
a.PNG/800px-Ukrainian_parliamentary_election_2007_(BYuT)a.PNG)


