From Wikipedia, the free encyclopedia
.svg/800px-Sinc_function_(normalized).svg.png)
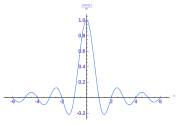
Graph of the normalized sinc function sin(πx)/(πx).
[edit] Instructions
See Wikipedia graph-making tips.
Generated in gnuplot with the following script:
# Set 1300×975 SVG output and filename
# The font size (fsize) sets the size for the circles, too.
set samples 400
set terminal svg enhanced size 1300 975 fname "Times" fsize 36
set output "sinc function (normalized).svg"

# Set y axis limits so the plot doesn't go right to the edges of the graph
set yrange [-0.3:1.1]
set xrange [-6:6]

set lmargin 5
set bmargin -5

# No legend needed
set nokey

# Add lightly-colored axis lines
set yzeroaxis
set xzeroaxis

# Put a y-axis tic at every 0.2
set ytics 0.2
set mytics 4

# Format tics as digit with one decimal place
set format y "%2.1f"

# Put an x-axis tic at every integer
set xtics 1
set format x "%2.0f"
set mxtics 5

# Plot as lines
plot sin(pi*x)/(pi*x) with lines

# Close the file (so I don't have to close gnuplot to view it)
set output
Then I opened the resulting SVG file in Inkscape, changed the line colors, brought the plot lines to the top, made all the lines 3 px wide, made the grid lines 2px wide and 50% transparency.
[edit] License
Created by User:Omegatron using gnuplot, possibly with post-processing in the GIMP (PNG) or Inkscape (SVG)
|
I, the copyright holder of this work, hereby publish it under the following licenses:
You may select the license of your choice.
|
(In short, this means that you can copy and modify the image freely as long as you provide attribution; preferably in the form of a link back to this page.)
[edit] External links
File history
Click on a date/time to view the file as it appeared at that time.
| Date/Time | Dimensions | User | Comment |
|---|
| current | 17:36, 3 June 2006 | 1,300×975 (23 KB) | Omegatron | |
| 17:32, 3 June 2006 | 1,300×975 (19 KB) | Omegatron | |
| 03:03, 22 May 2006 | 1,000×750 (14 KB) | Omegatron | |
File links
The following pages on the English Wikipedia link to this file (pages on other projects are not listed):
.svg/800px-Sinc_function_(normalized).svg.png)


