Image:Phanerozoic Biodiversity.png
From Wikipedia, the free encyclopedia

No higher resolution available.
Phanerozoic_Biodiversity.png (627 × 371 pixels, file size: 21 KB, MIME type: image/png)
| | This is a file from the Wikimedia Commons. The description on its description page there is shown below.
|
 |
This graph image should be recreated using vector graphics as an SVG file. This has several advantages; see Commons:Media for cleanup for more information. If an SVG form of this image is already available, please upload it. After uploading an SVG, replace this template with template {{Vector version available|new image name.svg}} in this image. |
|
العربية | Български | Català | Česky | Dansk | Deutsch | English | Esperanto | Español | Français | 한국어 | Italiano | Magyar | Lietuvių | Nederlands | 日本語 | Polski | Português | Română | Русский | Suomi | Svenska | Türkçe | Українська | Tiếng Việt | मराठी | 中文(繁體) | 中文(简体) | +/- |
|
[edit] Description
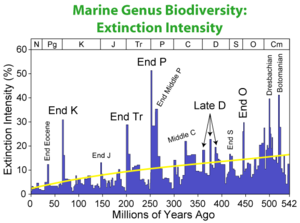
Following Rohde & Muller (2005), this figure shows the apparent changes in marine biodiversity throughout the last 542 million years (the Phanerozoic eon) based on the first and last appearance of the 36380 genera recorded in the Sepkoski Compendium (2002). The "Big Five" mass extinctions of Raup and Sepkoski (1982) are labeled as well as a number of additional, but less well-known extinction events. Conventional symbols for the periods of w:geologic time appear along the bottom. The distinctions for "all genera" and "well-resolved genera" follow Rohde & Muller (2005) and reflect either the inclusion of all of Sepkoski's taxa or only those where the first and last appearances were well-defined in time.
It is presently a matter of scientific debate whether the long-term trend appearing here is a genuine reflection of biological changes or is instead a reflection of the biases inherent to the process of paleontological investigation. Some have argued that most, or all, of the large rise going into the modern day is merely a reflection of the greater availability and preservation of recent geologic sections. Others dispute this, and argue that most of the long-term changes reflect genuine biological processes.
Rohde & Muller also argue that the fluctuations in biodiversity, especially occurring in the early part of the record, are too regularly spaced to have occurred by random chance. They conclude on the basis of a statistical argument that some unknown process influenced the waxing and waning of life with roughly a 62 million year periodicity. Periodic astronomical and geophysical processes are considered, but no particular process is definitively implicated.
[edit] Copyright
This figure was originally prepared by Dragons flight from published data and is released under the GFDL.
[edit] References
- Raup, D. & Sepkoski, J. (1982). "Mass extinctions in the marine fossil record". Science 215: 1501–1503.
- Rohde, R.A. & Muller, R.A. (2005). "Cycles in fossil diversity". Nature 434: 209-210.
- Sepkoski, J. (2002) A Compendium of Fossil Marine Animal Genera (eds. Jablonski, D. & Foote, M.) Bull. Am. Paleontol. no. 363 (Paleontological Research Institution, Ithaca, NY).
File history
Click on a date/time to view the file as it appeared at that time.
| Date/Time | Dimensions | User | Comment | |
|---|---|---|---|---|
| current | 20:40, 26 February 2006 | 627×371 (21 KB) | Merikanto | (Class Phanerozoic, Biodiversity curve. ) |


